Forecasting Physical Activities - A Predictive Model
In the present era, marked by the extensive adoption of wearable technology like smartwatches, smartphones, and wristbands, there arises an increasing necessity to comprehend user behaviors and their interconnections across diverse activities. Equipped with specialized sensors, these devices serve multifaceted functions. For instance, accelerometer and gyroscope sensors track movements and rotations, facilitating responsive gestures and orientation changes. Moreover, magnetometer sensors aid in navigation by detecting Earth’s magnetic field for precise directional guidance. Heart rate sensors monitor pulse rates, offering insights into health and fitness levels, while GPS sensors pinpoint exact locations for mapping and location-based services. Together, these sensors gather data on movement patterns, heart rate fluctuations, and geographical coordinates, thereby enhancing device capabilities and user experiences.
Consequently, today’s exploration delves deeper into data science, with a focus on predicting individuals’ physical activity based on various input factors provided to a model. The activities targeted for forecasting encompass are:
⦿ Walking
⦿ Cycling
⦿ Sitting
⦿ Standing
⦿ Playing soccer
⦿ Ironing
⦿ Vacuum cleaning
⦿ Ascending stairs
⦿ Descending stairs
⦿ Nordic walking
⦿ Running
⦿ Rope jumping
To fuel this predictive model, we’ll gather data from smartwatches and smartphones, leveraging sensors like accelerometers, gyroscopes, and magnetometers, which capture diverse aspects of movement and orientation. Specifically, readings will be collected from these sensors across three distinct body locations: the hand, ankle, and chest. Our objective is to obtain a thorough understanding of the user’s physical activity and movement patterns by utilizing data from various sensors and body positions. Furthermore, we will leverage the sklearn library in Python during our analysis to improve the accuracy and effectiveness of the model’s predictions.
After training our model using data collected from smartwatches and smartphones, which includes readings from accelerometers, gyroscopes, and magnetometers across different body locations, we can use the confusion matrix to assess how well our model is performing in predicting each activity category.
What does the term ‘confusion matrix’ refer to?
The confusion matrix provides a comprehensive breakdown of the model’s predictions compared to the actual ground truth. Each row of the matrix represents the actual classes, while each column represents the predicted classes.
For example, if we consider the activity of “walking”, the confusion matrix will show us how many instances of walking were correctly predicted as walking (true positives), how many instances of walking were incorrectly predicted as another activity (false negatives), how many instances of other activities were incorrectly predicted as walking (false positives), and how many instances of other activities were correctly predicted as not walking (true negatives).
Here is the code snippet I wrote:
Here are the results generated as output:
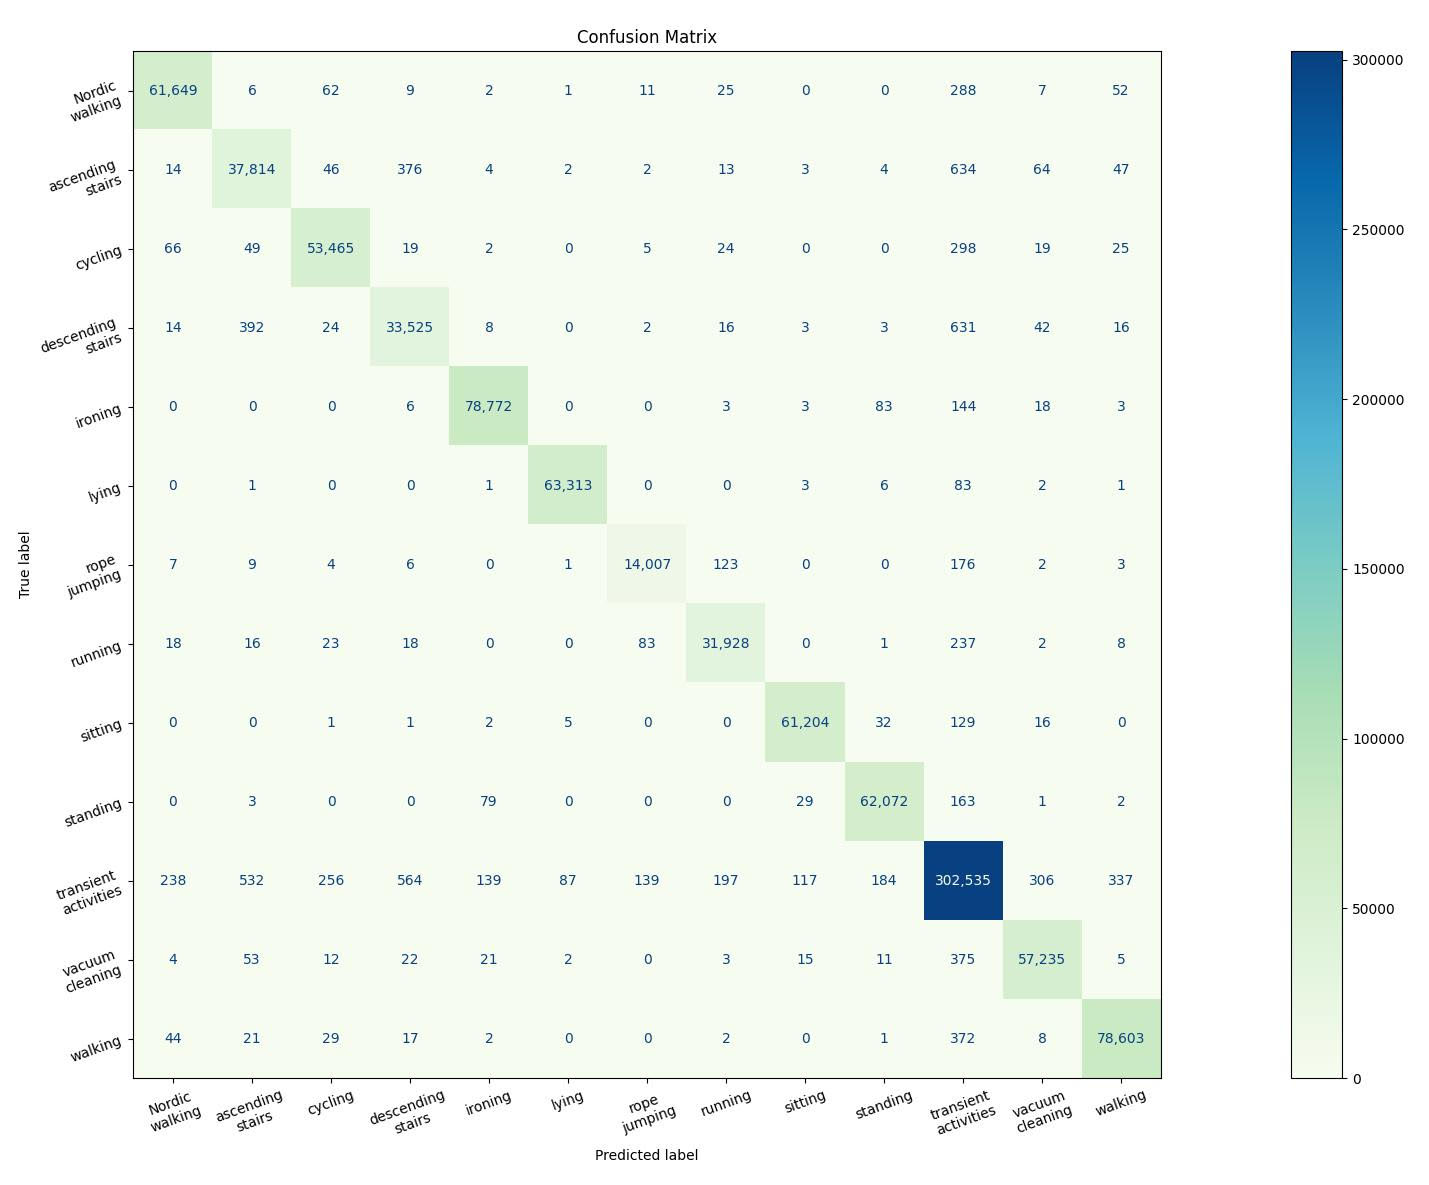
By analyzing the confusion matrix, we can identify which activities our model is performing well in predicting and which ones it struggles with.
Using the confusion matrix we can get a better grasp where our is lacking, so will be able in the future to focus and improve its accuracy and effectiveness, ultimately leading to better predictions of individuals’ physical activities.
Moreover, we have printed the accuracy of our final model, it reaches an impressive score of 0.990.
In summary, utilizing scikit-learn allows us to effortlessly build classical machine learning models.