Loan Insights Unlocked - ( Post 1 of 3 )
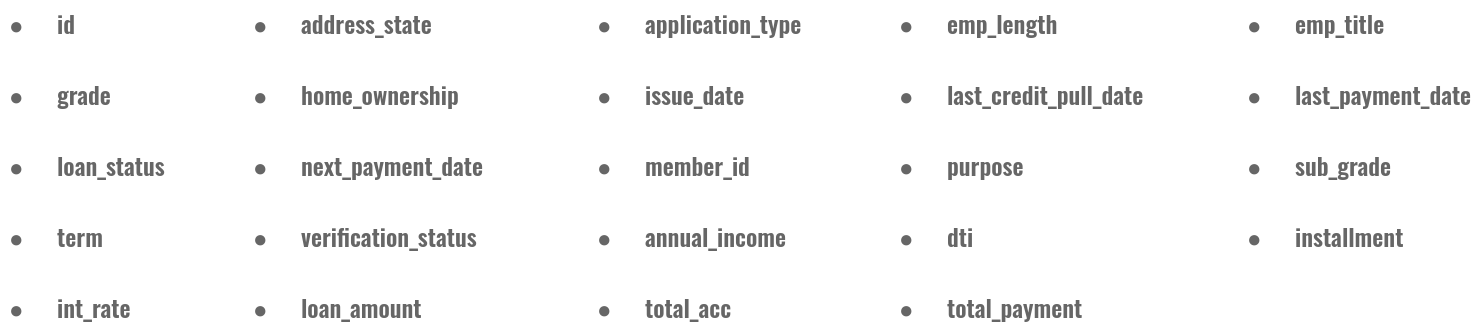
Today, we’re delving into a financial dataset centered on the topic of ‘Loans’. Obtained from Kaggle, this dataset titled ‘Comprehensive Loan Information for Credit Risk’ comprises an extensive array of data with 24 columns and 38,576 rows.
Here’s a quick overview of the column names:
Before diving into the dataset’s analysis, let’s start with a fundamental question:
“What exactly is a loan?”
A loan is a financial arrangement in which one party, typically a lender such as a bank or financial institution, provides money or assets to another party, known as the borrower. The borrower agrees to repay the loan amount over time, usually with added interest or fees. Loans can be used for various purposes, such as purchasing a home, financing education, starting a business, or covering personal expenses. The terms of the loan, including the amount borrowed, interest rate, repayment schedule, and any collateral required, are typically outlined in a legal contract between the lender and the borrower.
Now that we’ve clarified the concept, let’s delve into analyzing the dataset. We’re poised to explore some intriguing questions today.
We’ll kick off with our first inquiry. As we’re all aware, the United States comprises 50 states. As we peruse the dataset, I’m curious:
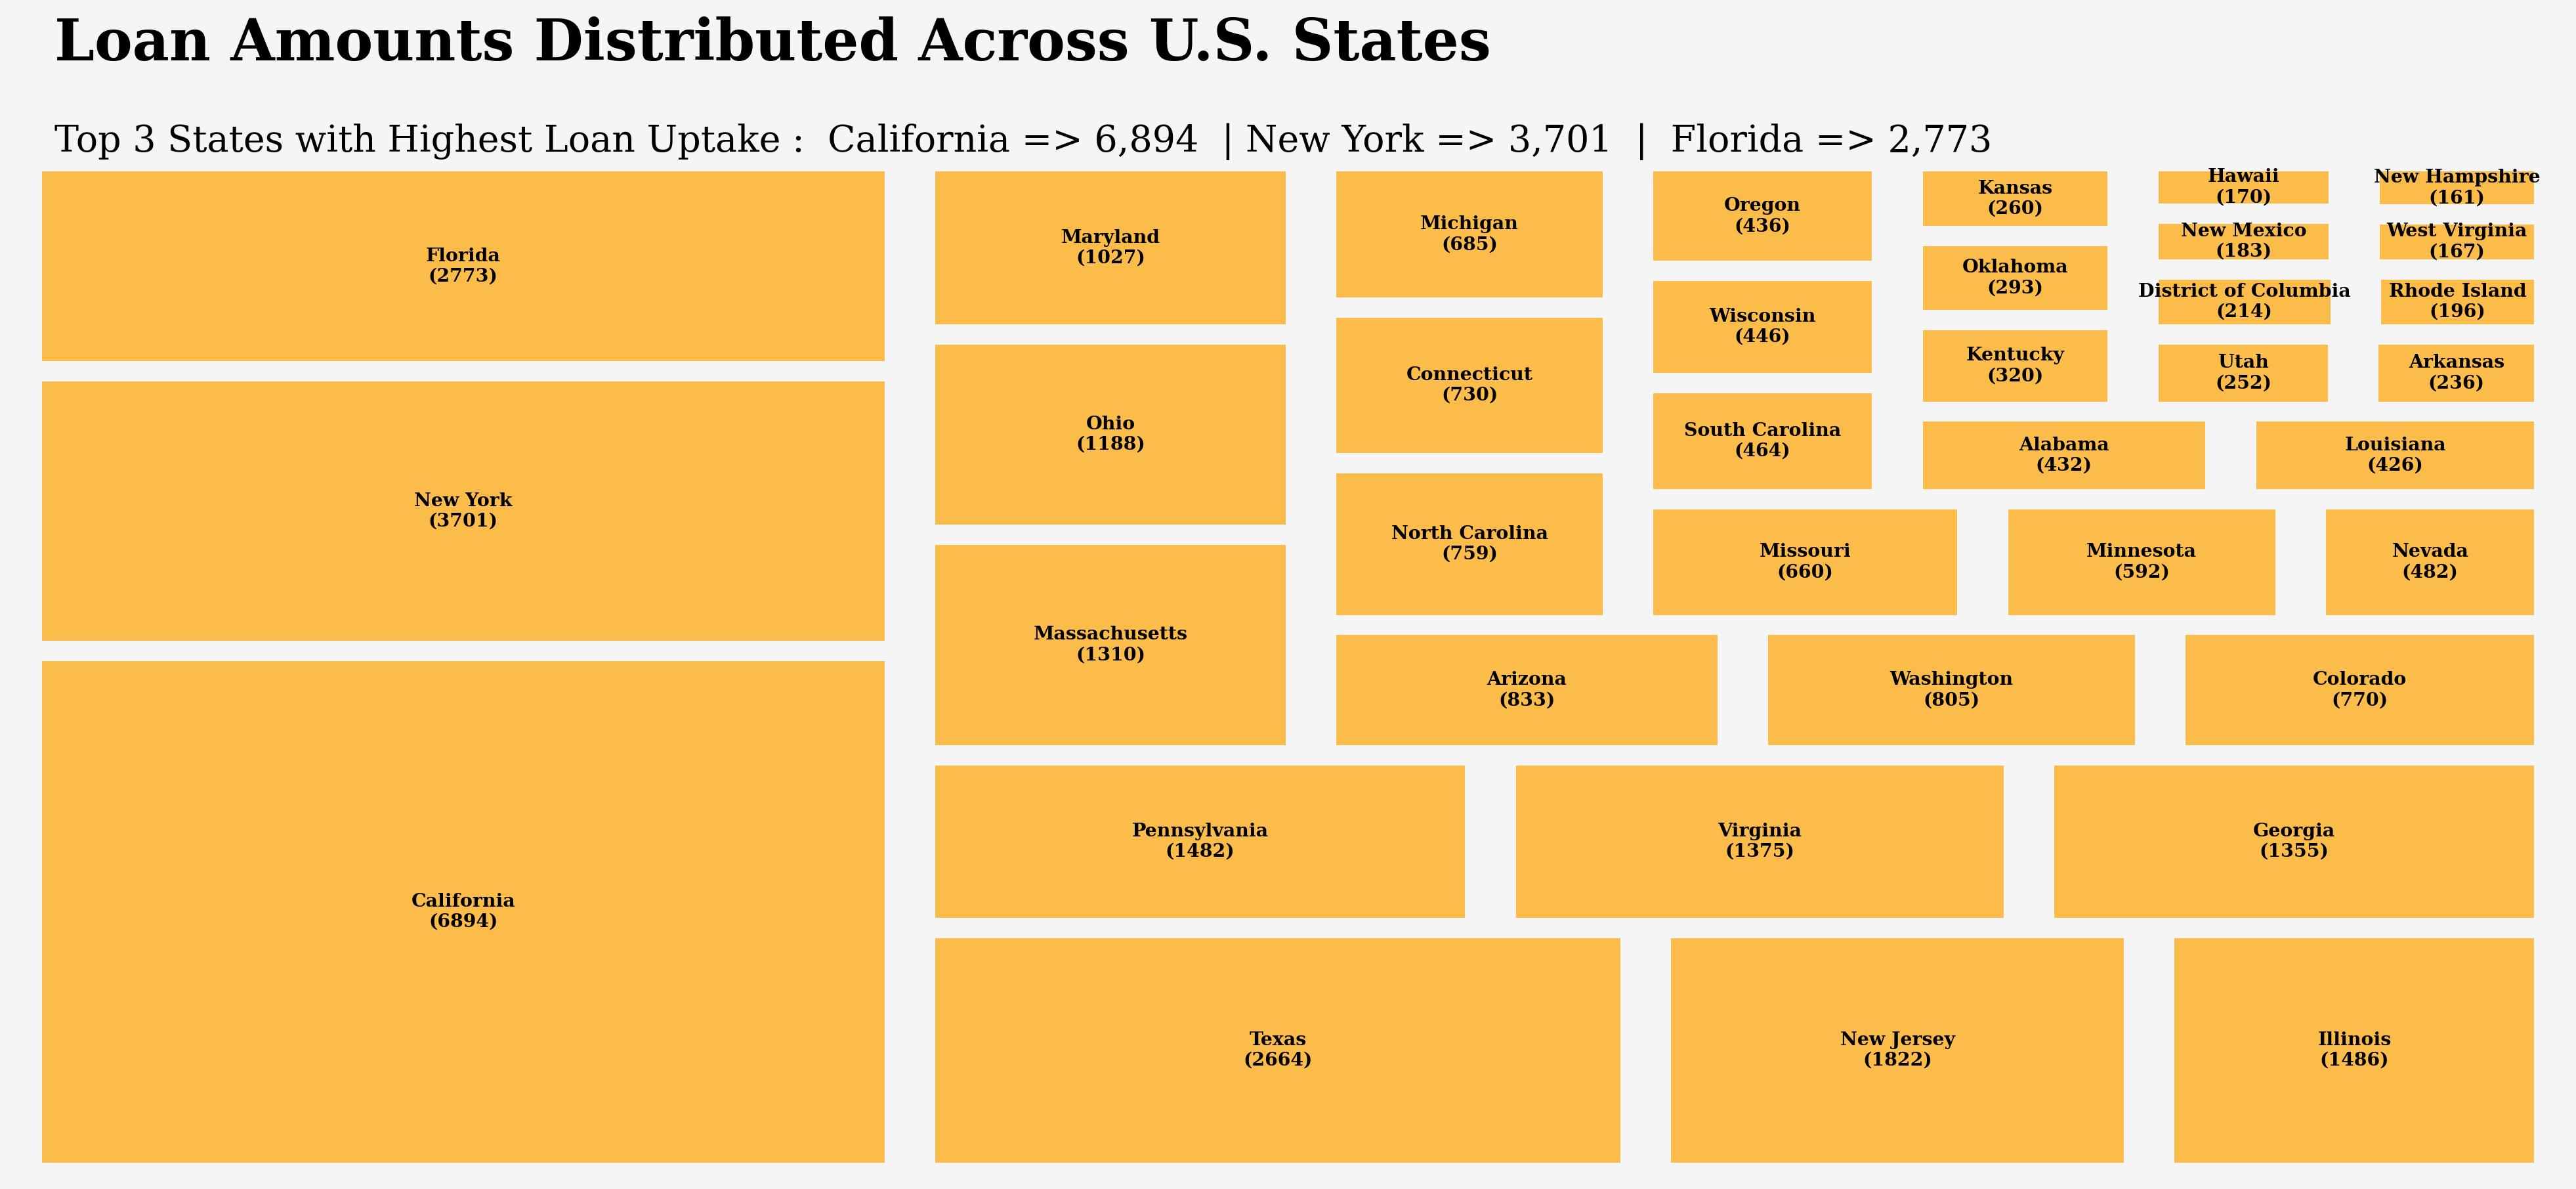
In which state do residents take out the most loans?
Some may initially suggest states with higher poverty rates, such as Mississippi, Louisiana, and West Virginia, assuming they have the highest loan rates. However, let’s reserve judgment and allow the analysis to speak for itself as we examine the data.
Upon initial review, it appears that those who anticipated a correlation between high poverty rates and increased loan uptake were mistaken. Surprisingly, the top states for loan acquisition are California, New York, Florida, Texas, and New Jersey, which diverges from our initial assumptions.
There could be numerous factors at play here. Firstly, it’s evident that the prevalence of loans isn’t directly tied to poverty rates as previously presumed. Supporting evidence can be found in a comparison with data from sources like Wikipedia’s ‘List of U.S. states and territories by poverty rate’.
For instance, New York ranks 19th with a poverty rate of 13.58%, Texas sits at 14th with 14.22%, California holds 26th place with a poverty rate of 12.58%, Florida ranks 20th with a poverty rate of 13.34%, and New Jersey stands at 47th with a poverty rate of 9.67%.
In short, the main factor is that using loans involves accounting strategies that can greatly affect individuals’ personal finances, aiming for lower interest rates and tax reductions. This dynamic underscores the intricate interplay between financial decisions, tax optimization, and the pursuit of favorable lending terms.
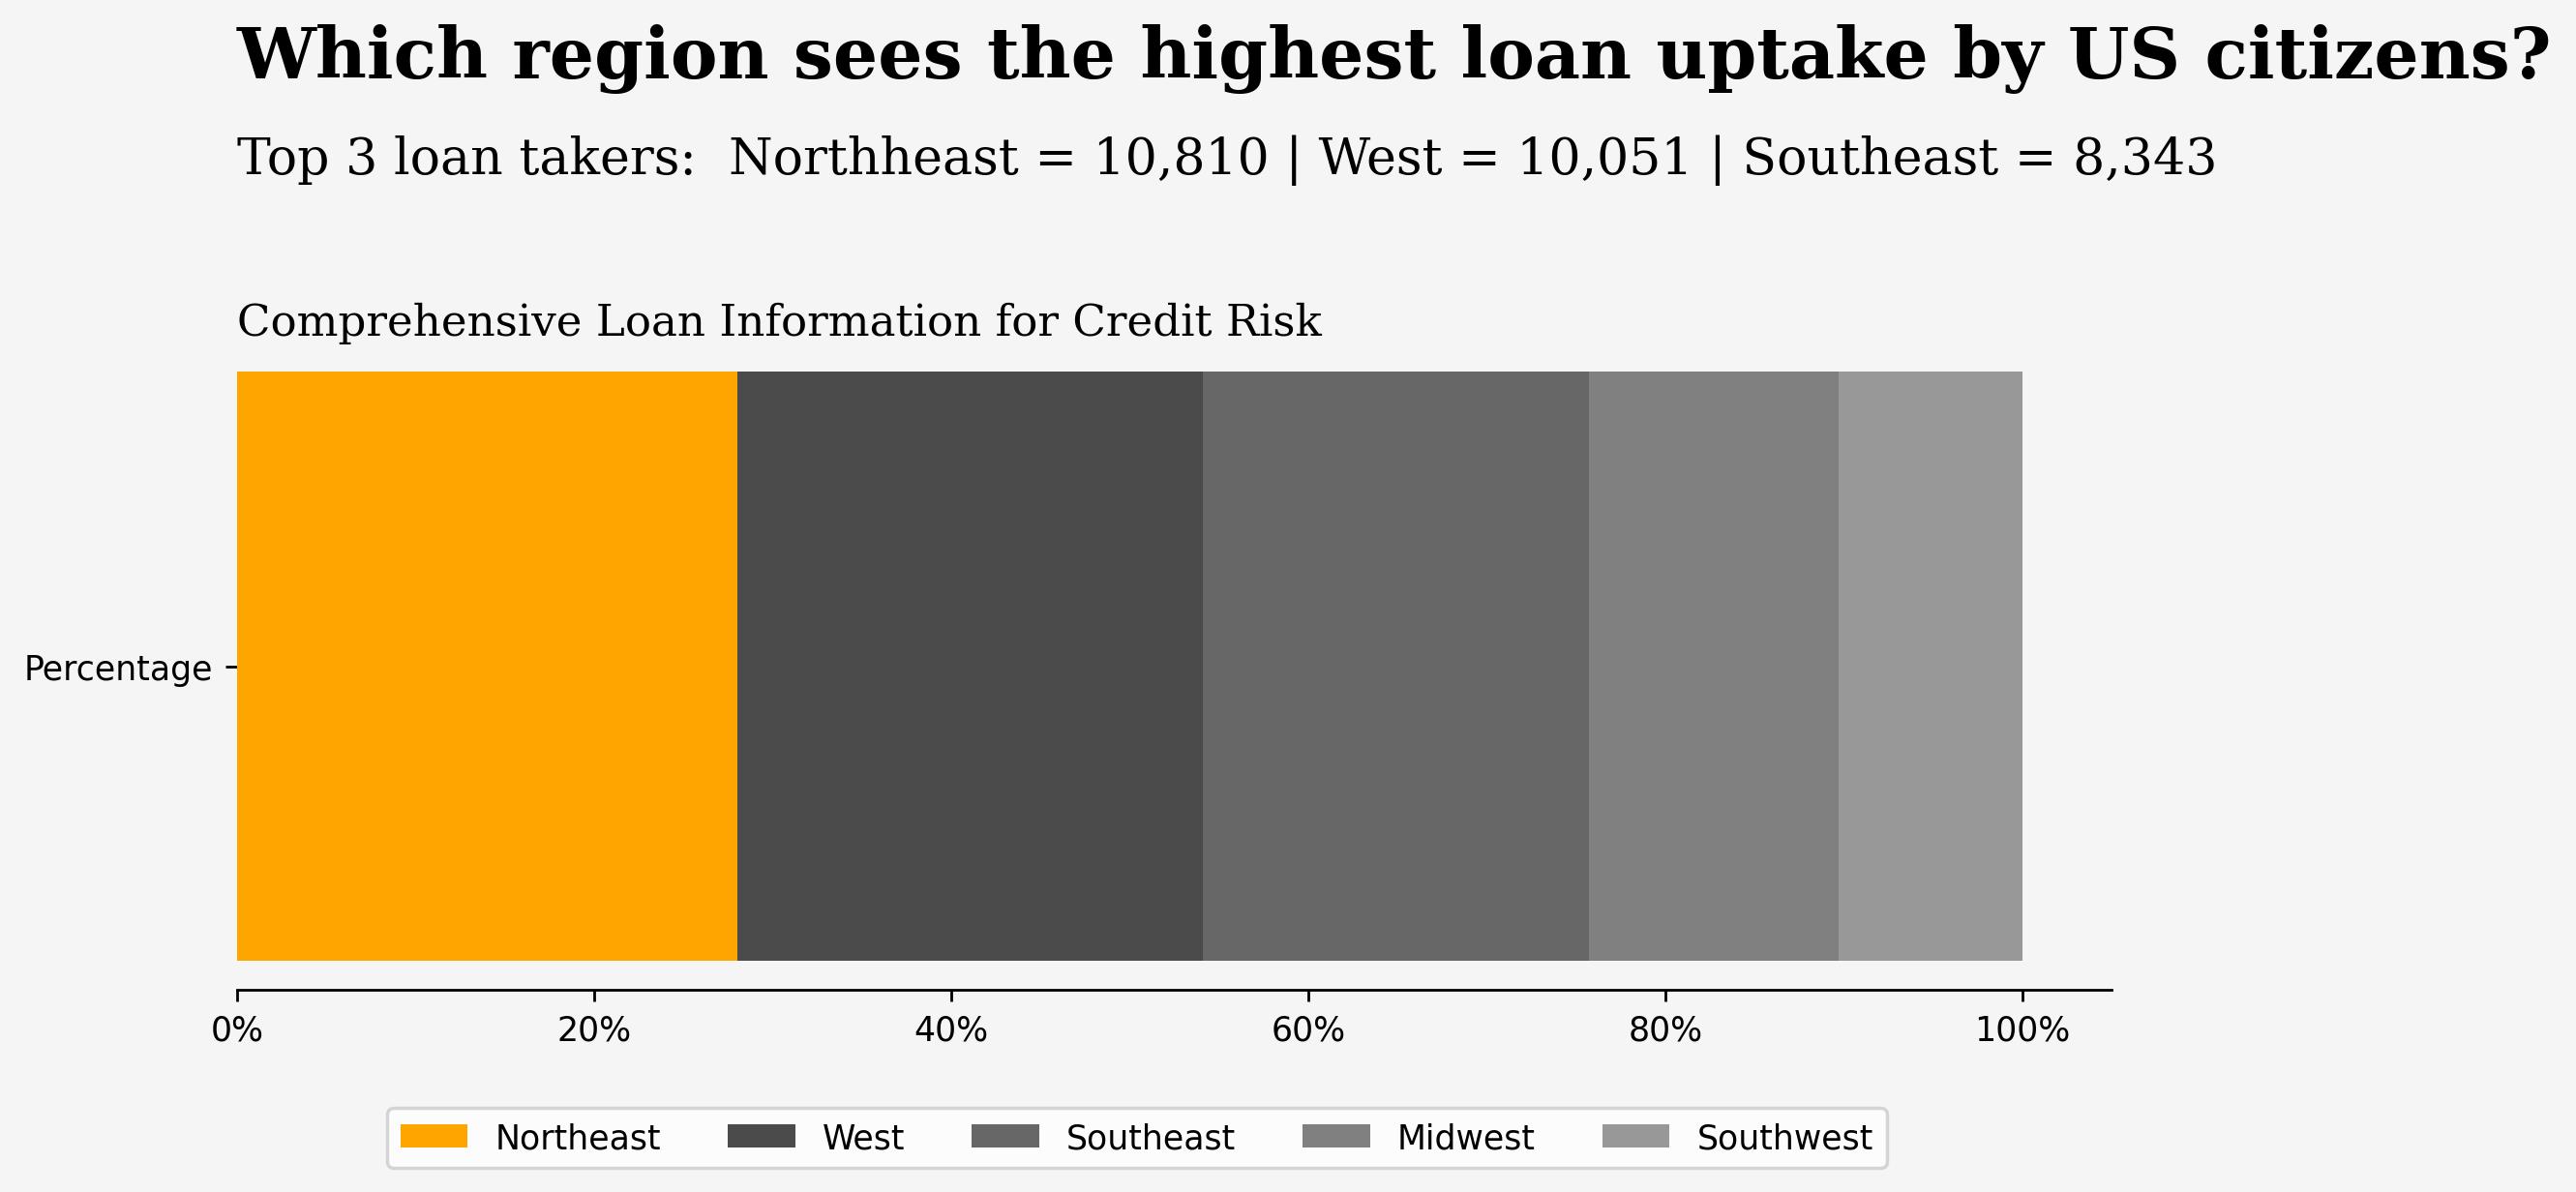
After examining all the states across the US, my attention now shifts to regions. I’m curious to discover:
“In which region — Northeast, West, Southeast, Midwest, or Southwest—are the most active loan takers?”
Upon reviewing the output results, it becomes apparent that the Northeast region exhibits the highest level of activity, boasting 10,810 loan takers (including states such as Maryland, New Jersey, and New York) - comprising 28% of the total. Following closely is the West region, also demonstrating considerable activity, with 10,051 loan takers (encompassing states such as Washington, California, and Colorado) - representing 26%. Moving on, the Southeast region emerges as another active hub, boasting 8,343 loan takers (encompassing states such as Florida and South Carolina) - constituting 21.6% of the total. The Midwest region comes fourth in terms of activity, showcasing 5,399 loan takers (encompassing states such as Minnesota and Kansas) - representing 14% of the total. Lastly, the Southwest region demonstrates relatively lower activity, with 3,973 loan takers (encompassing states such as Arizona and Texas) - comprising 10.29% of the total.