Loan Insights Unlocked ( Post 3 of 3 )
Today we will continue with analyzing the Kaggle dataset titled ‘Comprehensive Loan Information for Credit Risk’.
As we go over the dataset we can notice 2 super important columns: “sub_grade” and “grade”. Those columns are related to the loans grading system.
The loans grading system is a method used by lenders and investors to evaluate the creditworthiness and risk level of individual loans. It categorizes loans into different grades and sub-grades based on various factors such as the borrower’s credit history, income, debt levels, and other risk indicators.
Grades (A through G):
- Loans are typically categorized into seven main grades, labeled from A through G.
- Each grade represents a different level of credit risk, with Grade A loans being the least risky and Grade G loans being the most risky.
Sub-Grades (1 through 5):
- Within each main grade, there are usually sub-grades numbered from 1 to 5.
- Sub-grades further refine the risk assessment within each grade, providing a more nuanced evaluation of credit risk.
Now, Let’s explain about the Critical Role and Importance of the grading system:
Risk Evaluation:
The grading system’s central objective is to evaluate the credit risk inherent in each loan. Both lenders and investors rely on these grades to assess the likelihood of borrowers meeting their repayment obligations promptly and completely.
Interest Rate Determination:
Loans assigned higher grades usually incur lower interest rates, mirroring the perceived lower risk level associated with them. Conversely, loans with lower grades may carry higher interest rates to offset the heightened risk exposure. Investment Strategy Formulation:
Investors leverage loan grades to formulate well-informed investment strategies. This involves strategically allocating capital across different grades to construct a diversified portfolio that aligns with their risk tolerance and desired return objectives.
Loan Pricing Strategy:
Lenders utilize the grading system to devise pricing strategies for their various loan offerings. Higher-graded loans may enjoy more favorable terms and conditions, while lower-grade loans may be subject to higher fees or stricter eligibility criteria.
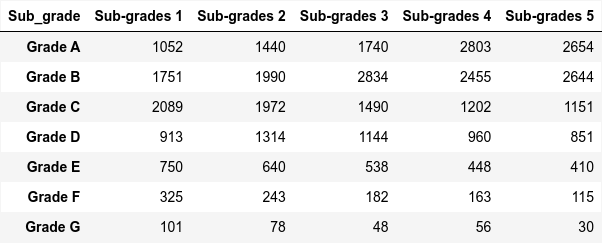
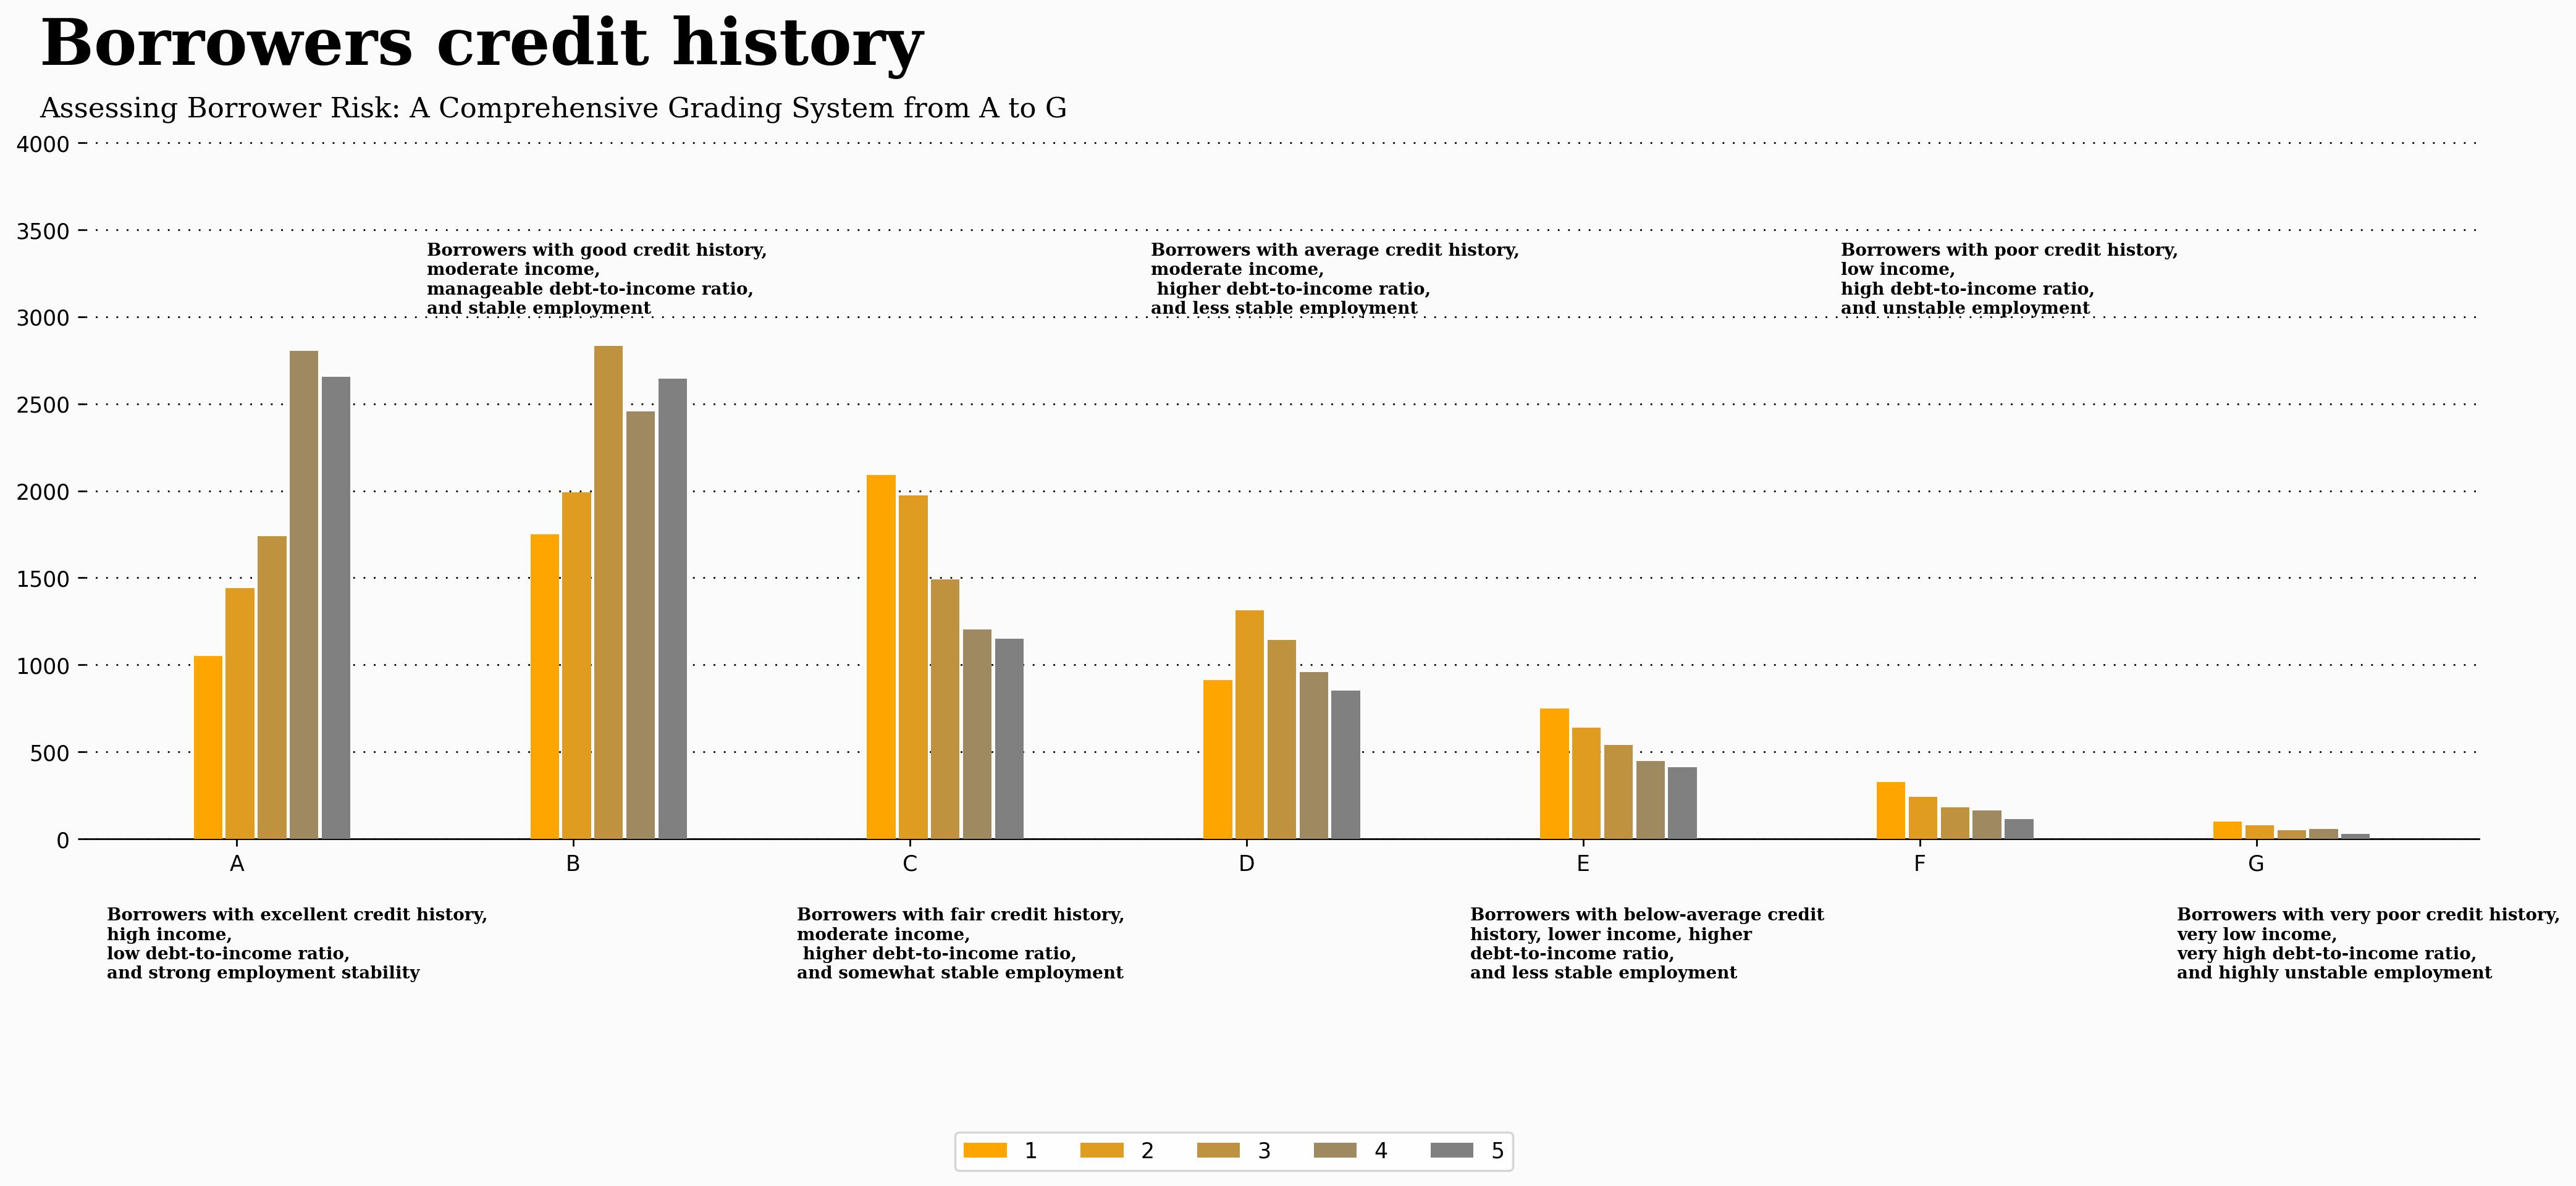
After providing a detailed overview, let’s now delve into the code to analyze the number of loans at each level. Below is the code I’ve prepared for this purpose:
Let’s see now the output result :
In my upcoming research, I aim to investigate the potential correlation between loan purposes and interest rates. To do so, I will focus on three key columns: ‘Int_rate’, ‘Purpose’, and ‘Region’. Although the raw dataframe initially lacks the ‘Region’ column, I have managed to derive it by manipulating the ‘address_state’ data, as I did in previous research.
My primary objective is to identify the predominant reasons for citizens taking out loans in each region. These reasons typically include debt consolidation, credit card expenses, home improvement, housing purchases, major purchases, small business ventures, cars, and weddings. Subsequently, I will analyze the interest rates associated with each loan purpose and determine the number of loans issued for each specific reason within a given interest rate range.
For instance, suppose I wish to examine housing purchases in the Northeast region. I can ascertain the number of citizens who acquired housing loans within a specified interest rate range, such as 20% to 24%, which amounts to 32 individuals.
Another scenario involves investigating debt consolidation loans in the Northeast region. I can identify the number of citizens seeking such loans with the lowest interest rate (0% to 4%) compared to the highest interest rate (20% to 24%), resulting in 1,820 and 1,614 loans, respectively.
This comprehensive analysis will provide valuable insights into the relationship between loan purposes and interest rates, facilitating informed decision-making for both lenders and borrowers.
Now, let’s dive into the code I wrote:


