Analyzing Heart Health Using Tableau for Deeper Insights
Today I would like to analyze a super interesting dataset about heart disease. The dataset has been taken from the Kaggle website.
The dataset presents 18 columns categories and the column names are:
I would like to dive deep into the data, and afterward present the results over several charts using tableau software. Asuasaul we will start and present the Dashboard I make using Tableau. In order to analyze the data I used, as always - python.
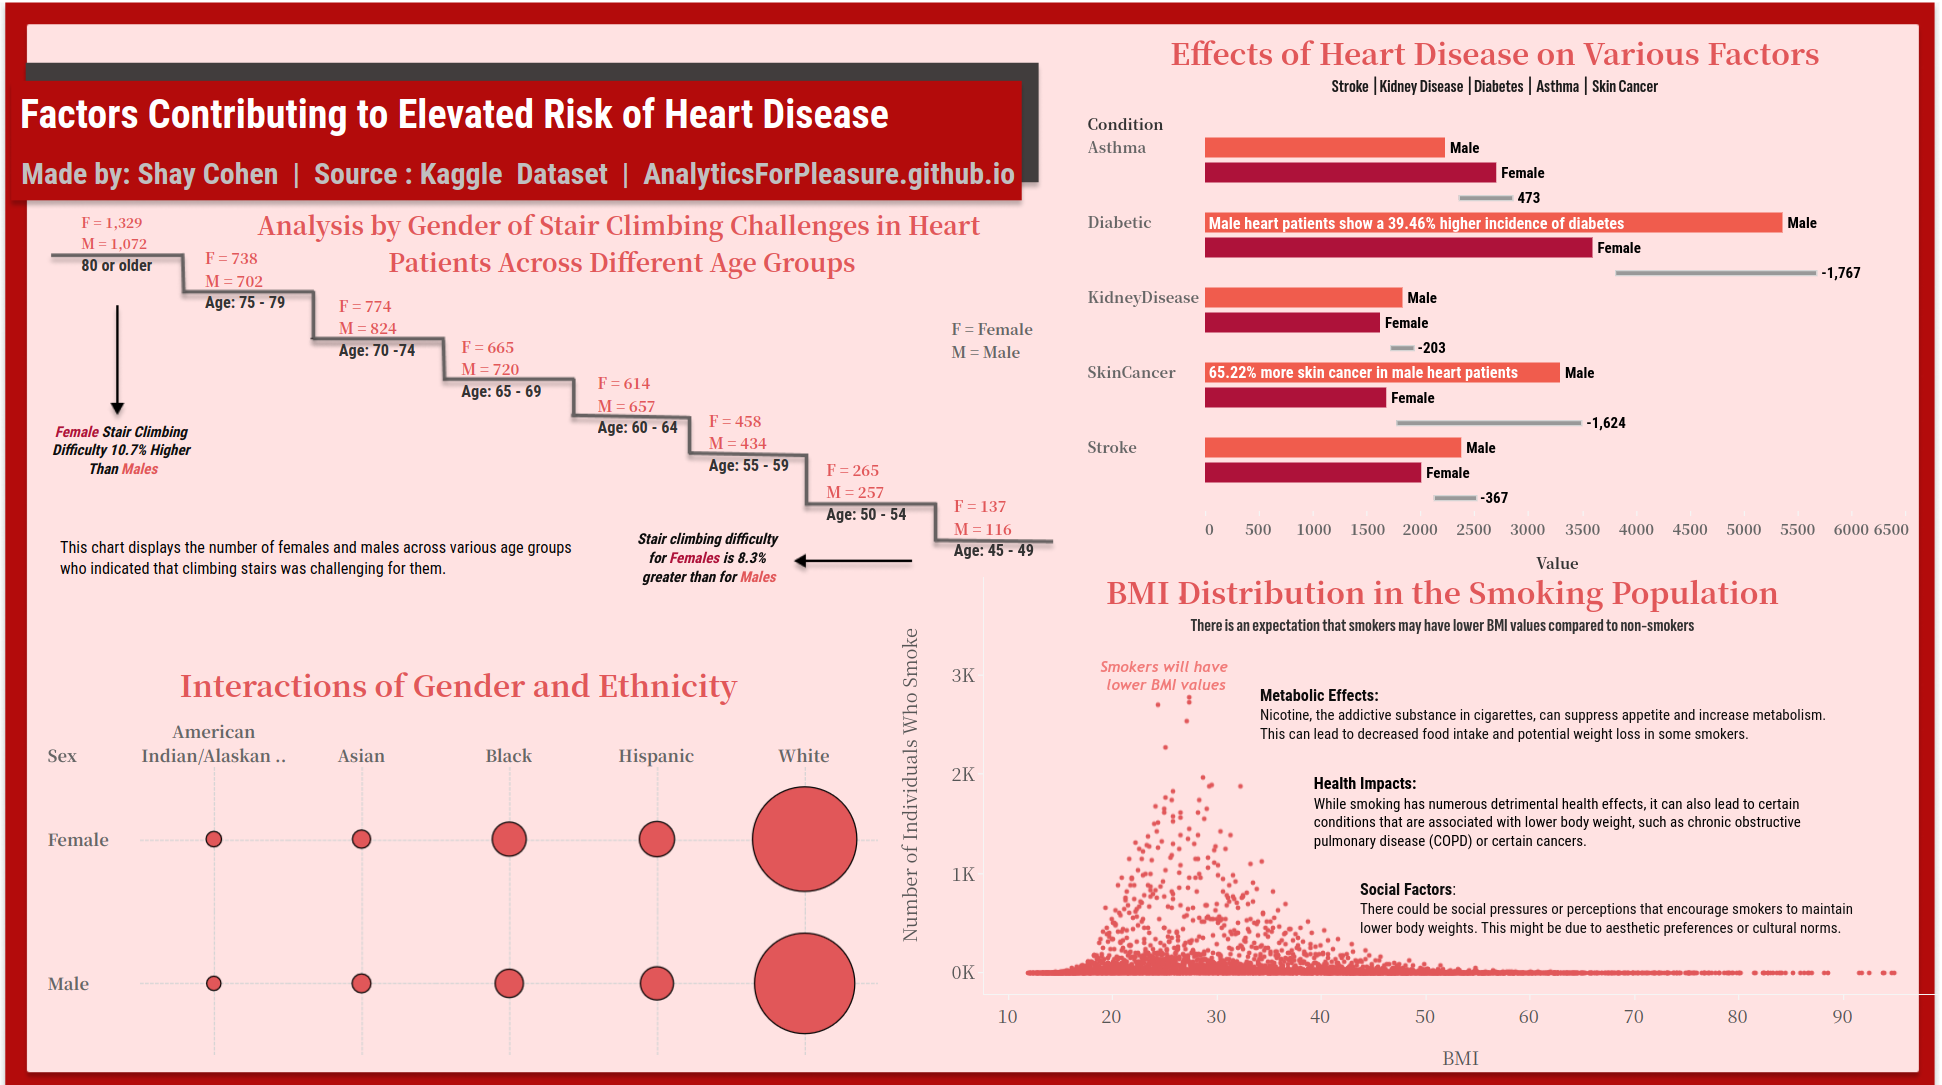
Here a brief overview of the dashboard:
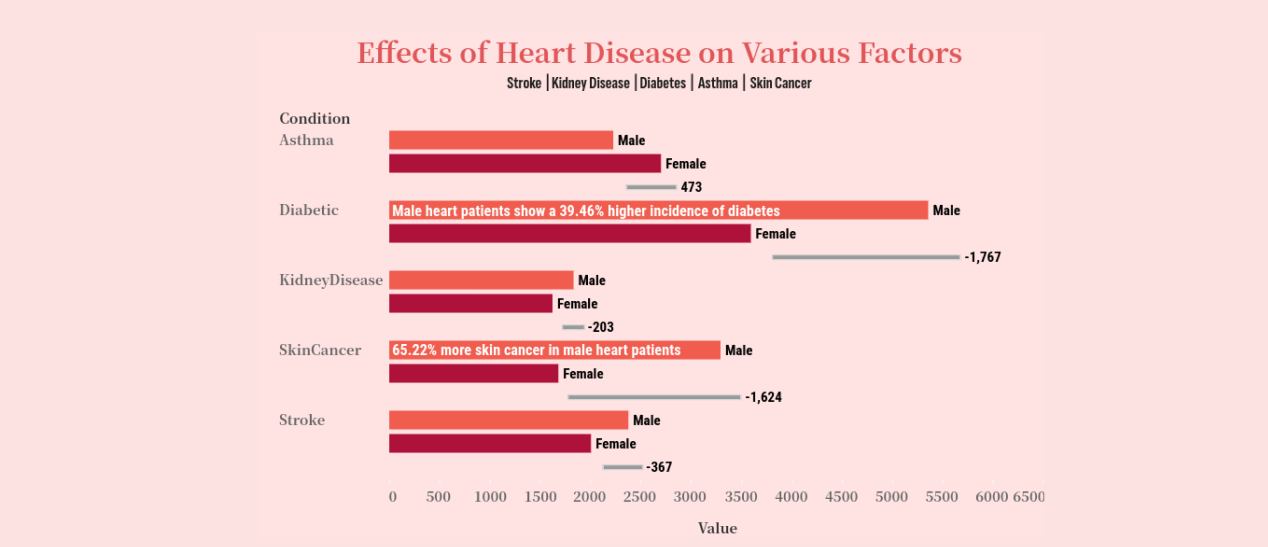
In my initial analysis, I aim to explore the relationship between heart disease and various health conditions, including asthma, diabetes, kidney disease, skin cancer, and stroke. A particular focus will be placed on understanding how these conditions manifest differently between males and females. For instance, upon examining the data, we observed a notable contrast in the prevalence of heart disease and diabetes between genders, with 1,767 more males affected than females. Additionally, our investigation revealed a significant disparity in the incidence of heart disease and skin cancer, with 1,624 more cases among males compared to females. Let’s see the outcome illustration :
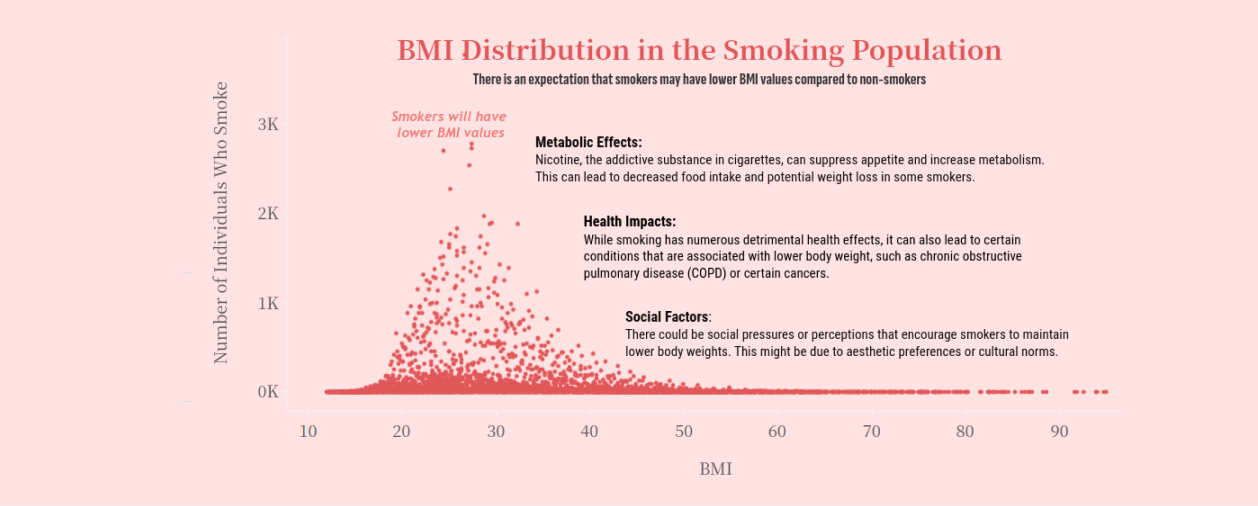
For my upcoming research, I intend to examine the Body Mass Index (BMI) among individuals diagnosed with heart disease. Firstly, let’s delve into what BMI represents.
BMI, or Body Mass Index, serves as a measure to evaluate an individual’s weight concerning their height. This calculation involves dividing a person’s weight in kilograms by the square of their height in meters (BMI = weight in kg / (height in meters)^2). By providing a straightforward numerical assessment of body fatness, BMI assists in categorizing people into groups like underweight, normal weight, overweight, or obese. In our forthcoming analysis, our focus will be on scrutinizing the distribution of BMI among smokers within the population. Data suggests that among those afflicted with heart disease, there exist smokers whose BMI falls within the lower spectrum (0-30).
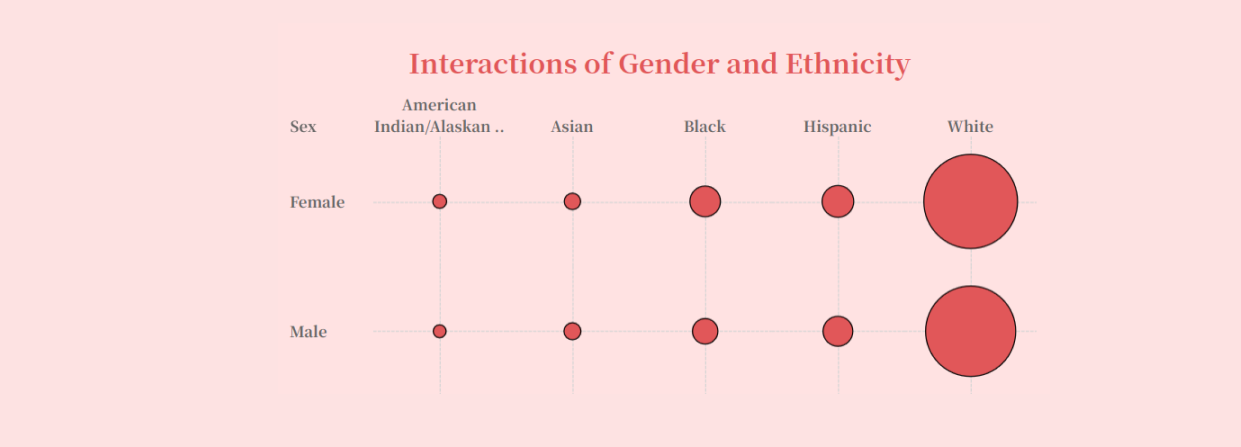
In the upcoming chart, my goal is to explore how gender (male versus female) interacts with ethnicity (American Indian, Asian, Black, Hispanic, and White) among individuals with heart disease. In simpler terms, we aim to understand the variations and proportions between genders and ethnicities. This analysis will provide valuable insights into potential disparities and demographic patterns within the context of heart disease prevalence. To effectively visualize and interpret these relationships, I’ve chosen to present the results using a matrix chart format.
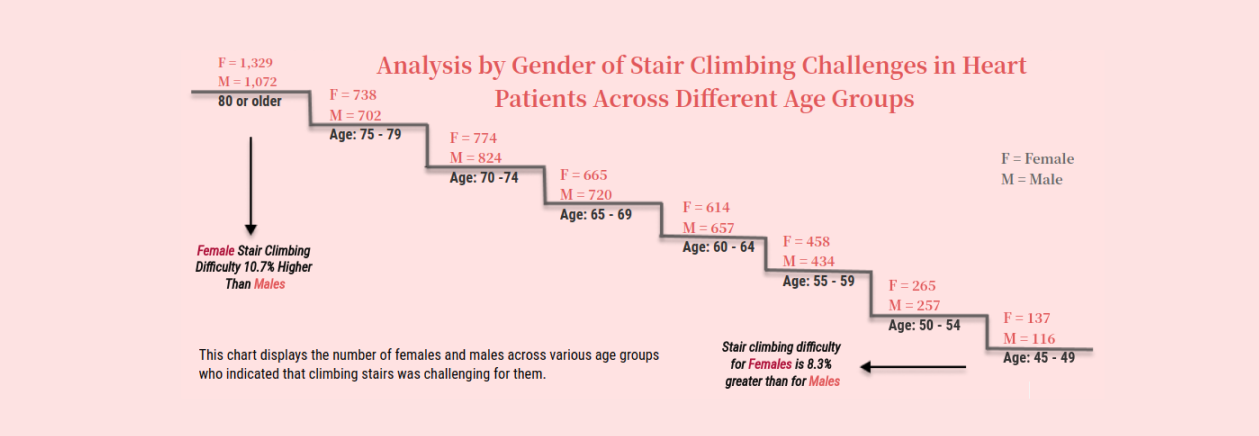
For my final analysis, I intend to explore the differential effects of heart disease on stair climbing abilities across various age groups and genders. To achieve this, we’ll closely examine data specific to individuals diagnosed with heart conditions. I suggest dividing the age groups into eight segments, each covering a five-year range: Group 1 (ages 45-49), Group 2 (ages 50-54), Group 3 (ages 55-59), Group 4 (ages 60-64), Group 5 (ages 65-69), Group 6 (ages 70-74), Group 7 (ages 75-79), and Group 8 (ages 80 or older). Within each age bracket, we’ll further segment the data based on gender.
Let’s now delve into the results of this analysis and assess how heart disease impacts stair climbing abilities among different demographic groups.
When we compare the age groups of 60-64 and 65-69, it becomes evident that a higher proportion of men struggle with stair climbing compared to women. Conversely, in the age brackets of 45-49 and among individuals aged 80 or older, there seems to be a greater prevalence of women facing challenges with stair climbing.

