NBA's Preference: Local vs. Foreign Players (Part 1: NBA Stats Series)
Today we will start with our first post of several posts. We will go over and analyze the data of the NBA, taken from the kaggle dataset.
This dataset contains a massive amount of information of 22 columns and 11,700 rows.
(11,700 *22 = 257,400 )
The NBA league is composed of 30 teams (29 in the United States and 1 in Canada) and is one of the major professional sports leagues in the United States and Canada. It is the premier men’s professional basketball league in the world. First of all, I have been thinking about which kind of interesting data we want to reveal to you all. Therefore, I came up with several ideas that could be fascinating and extraordinary all at the same time. for this kind of data. (After we find out , we will illustrate it by adding a nice chart). In order to “dive deep” into the data I will start with presenting to you the names of the columns taken from the CSV file.
‘player_name’, ‘team_abbreviation’, ‘age’, ‘player_height’, ‘player_weight’, ‘college’, ‘country’, ‘draft_year’, ‘draft_round’, ‘draft_number’, ‘gp’, ‘pts’, ‘reb’, ‘ast’, ‘net_rating’, ‘oreb_pct’, ‘dreb_pct’, ‘usg_pct’, ‘ts_pct’, ‘ast_pct’, ‘season’, ‘season_year’
As we can see above, the dataframe contains 22 columns. During our coding session we would like to add several columns in order to achieve our goal.
We will start with our first Question:
What is the percentage of foreign players over the years?
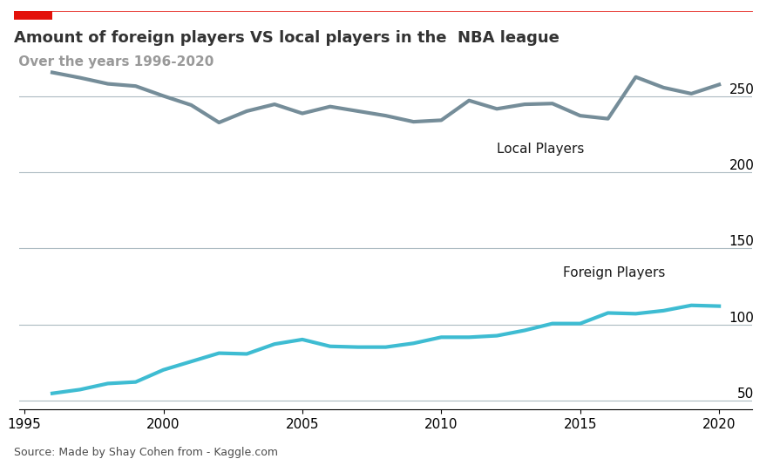
The National Basketball Association, as you perhaps similar with the NBA name, is a professional basketball league in North America. Over this league we have 30 teams which are located in the north of the US and in Canada. Each team had local players and foreign players from all over the world. Therefore, We are trying to get some sense of the ratio of foreign players VS local players over the 25 years (1996 - 2020) we have over the years.
After implementing this function we got a ratio of 15.9% are foreign players over the 25 years (between 1996-2020)
We can dive deeper into the numbers by understanding the trend of foreign players VS local players over each year. Here’s is the code I wrote:
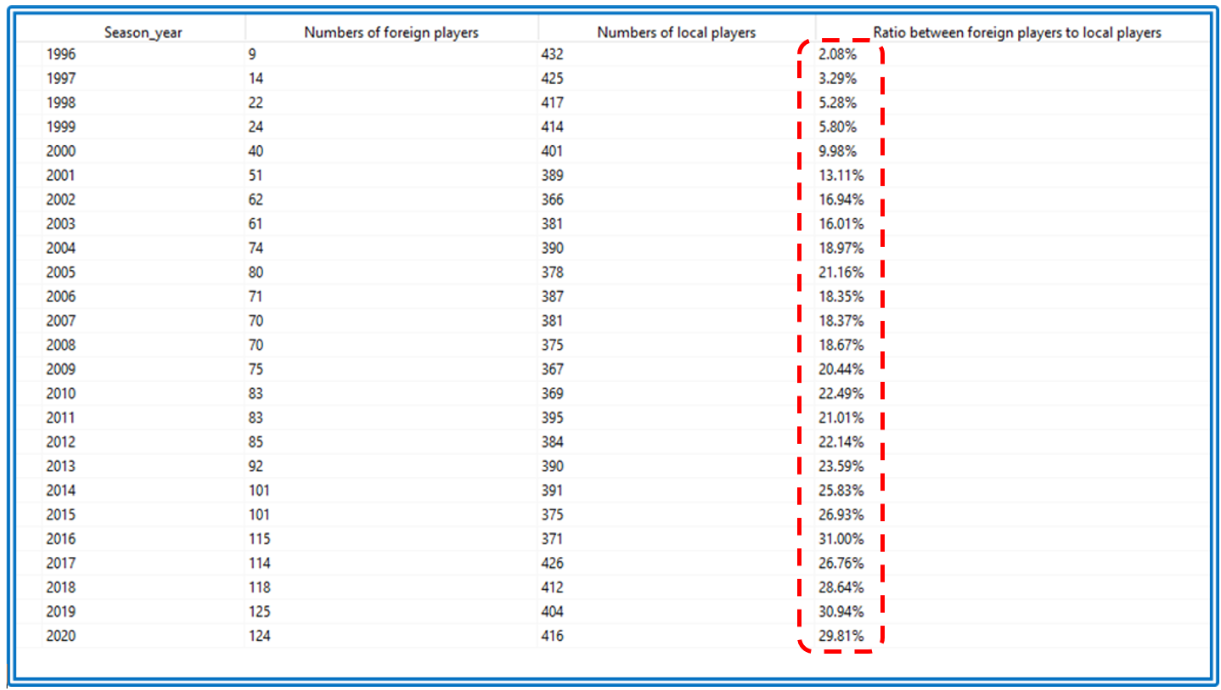
As we can see from the output table above, over the past 25 years there has been a big increase in the amount of foreign players playing in the NBA league. In 1996 there were only 9 foreign players in the entire league- which reflected 2 % of the local players. Nowadays, we can see a rise of foreign players to 124 in 2020, we are taking a massive turn of foreign players 22% of the local players - almost every one player from 5 players is a foreign player in the league.
Distribution of top-15 countries
The next question we would like to get a deeper insight and reveal the distribution of the 15 top countries for those foreign players.
Output data:
As we can see the first five counties that lead are in this category : France, Canada, Brazil, Australia and Spain. In order to illustrate this outcome we will add a chart function I have created.
The next thing I would want to examine and ask is :
What is the number of foreign players who played in each team?
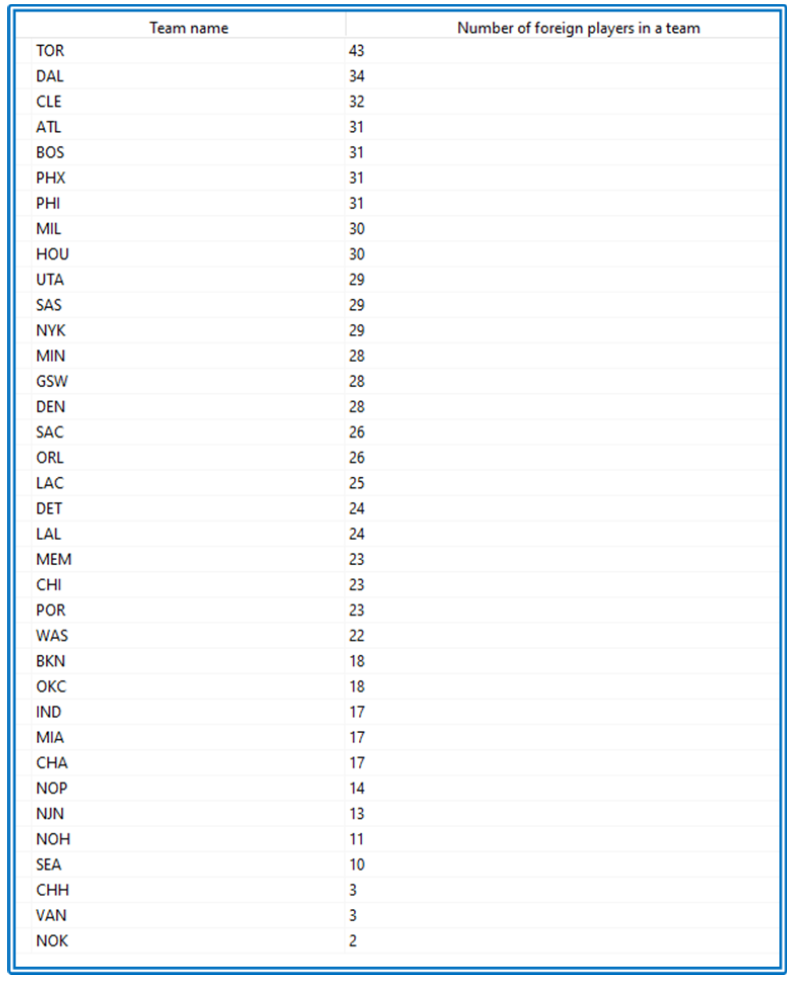
As we can see from the table above. the most foreign players who played in a team over the NBA - is the Toranto rapters with 43 foreign players in the last 25 years.