Rookie Progress: Year 2 in the NBA (Part 2: NBA Stats Series)
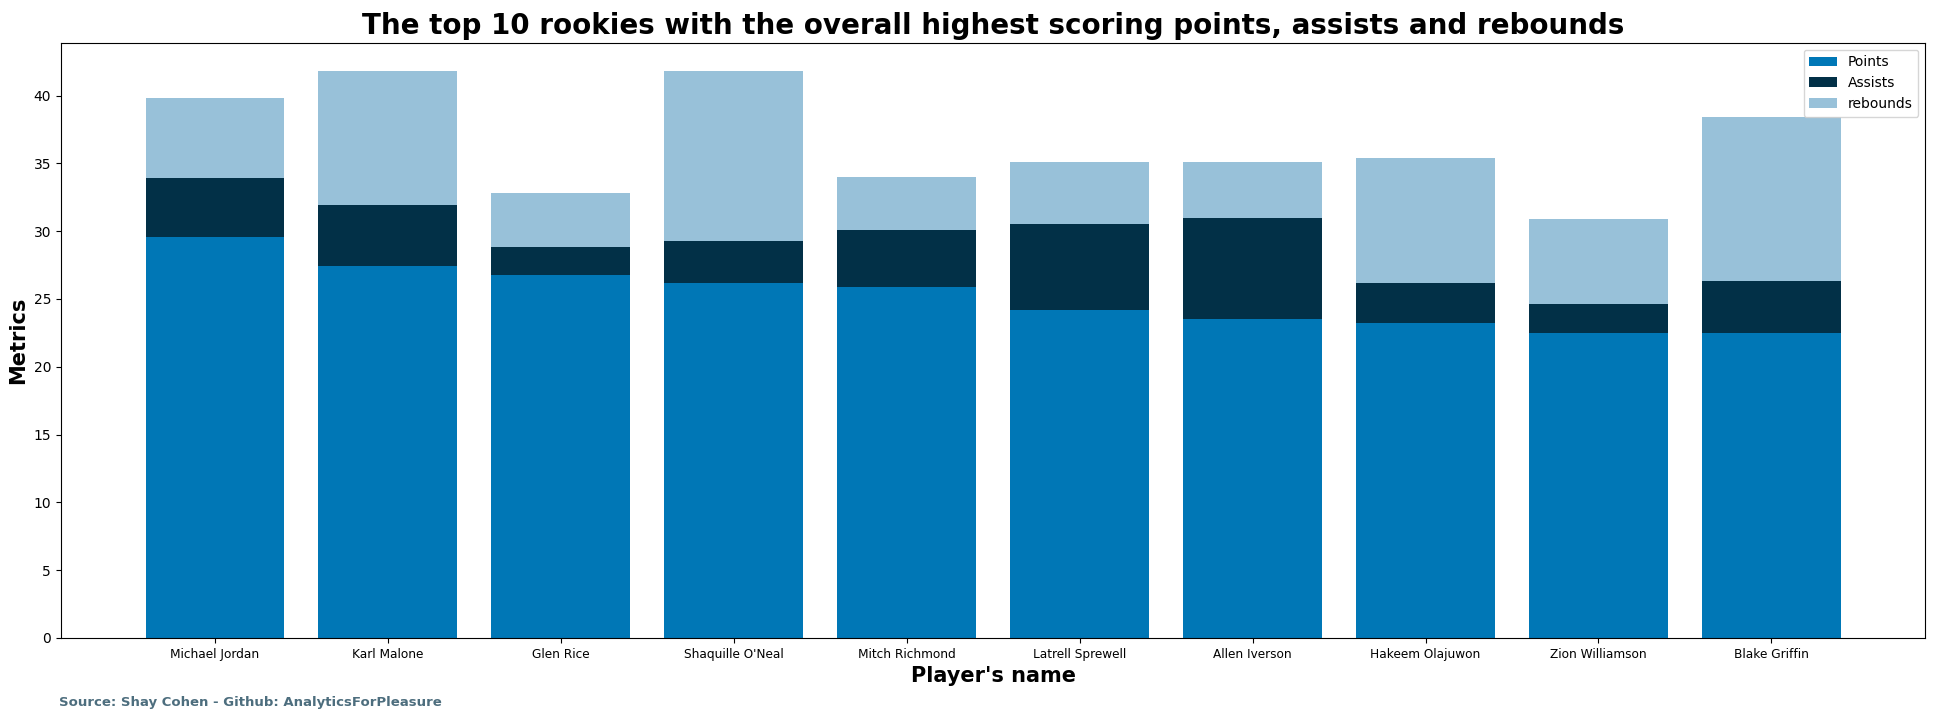
In the next insight we will go over several interesting columns of our data frame which will help us to analyze. My main idea here is to go over and compare between each player and examine their performance in the first year. The examination would be according different categories:
- Points ( In our data frame named as “pts”).
- Assists ( In our data frame named as “ast”).
- Rebounds ( In our data frame named as “reb”).
Now we need to understand the second part, which relates to the players who are in their first year in the NBA league. As some of you might know, the terminology of a player who plays in his first year in the league is called “Rookie”.
Each player who got to his rookie season( first season ) can get there in two different ways. The first way to get into the NBA league is by finishing college and afterwards the player passes his candidate for going to the NBA Lottery - this is the common phase.
The second way for a player to get to the NBA league is by going start forward to the NBA straight after High - school This phase is much less common during the league and only the most talented players will get there at the age of 18 / 19 years.
Therefore, in order to explore this data and answer the next question:
Who are the best 10 rookie players who played at the highest level for a rookie season?
(highest level = scored the top points ,assists and rebounds) we need to delve into the code I wrote - here below:
As we can see - I approach the code, as I said before, by dividing the data to two groups of rookies.
After retrieving the final data, I built a function which will illustrate the final data result.

My last answer deals with the drafted and undrafted rookies. Now I want to examine the improvement of the players in their second year playing in the NBA.
Is there any increase in points during their second year? And who made the most statistical improvement beyond the NBA players getting from his rookie season to the sophomore season ( = second season )?
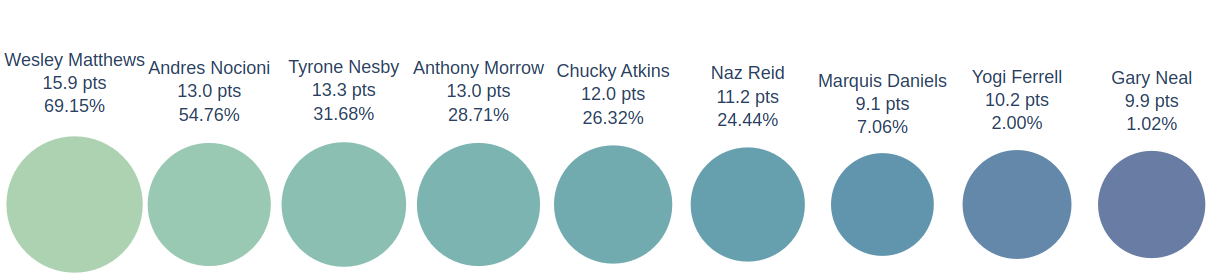
In order to solve this question I added a lower bound for threshold which presents the minimum points each player had in his first year. Then I added an “incremental pts percentage” column, which presents the percent change between rookie season points to sophomore season.
Another important thing I would like to point out is - improvement of a rookie player will be tested only if in his first year the rookie will pass the 8 points mark.
Here below the code I wrote:

In the table above we can notice a massive improval in points as the players entered their second year in the league. We can see a sharp increase in points for players such as Wesley Matthews, who finished his rookie season with an average of 9.4 points a game. A year later, Matthews upgraded his scoring abilities as he reached almost 16 points a game - An increase of 69% in points. Another extraordinary player we can distinguish is Andres Nocioni. His points number jumps 55% to 13 points.
My next question will continue with the same topic - Rookie player. I would like to know -
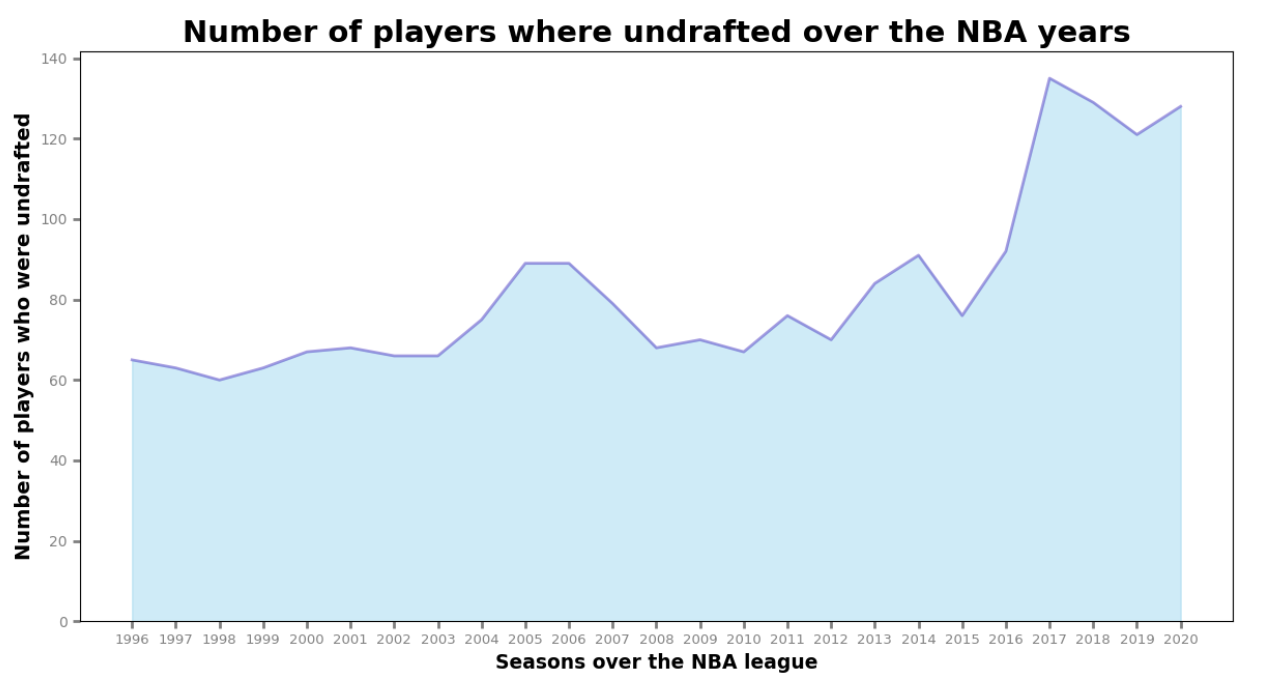
How many undrafted players were each year over the years? Is there an increase or decrease in the number of players who were undrafted ?
One point I would like to point out is about undrafted players. Players can be undrafted also if they came from G- league or came from the middle of the season for the first time.

Now, let’s illustrate the data of the undrafted players over the years (1996 -2020). As we can see below, a significant increase over the years. In 1996 there were only 67 undrafted players. And nowadays , the number doubles - more than 120 players.
After we find out how many undrafted players there were over 25 past year. lets find out the number of drafted players over the past 25 years.