Decoding 'True Shooting' in the NBA (Part 7: NBA Stats Series)
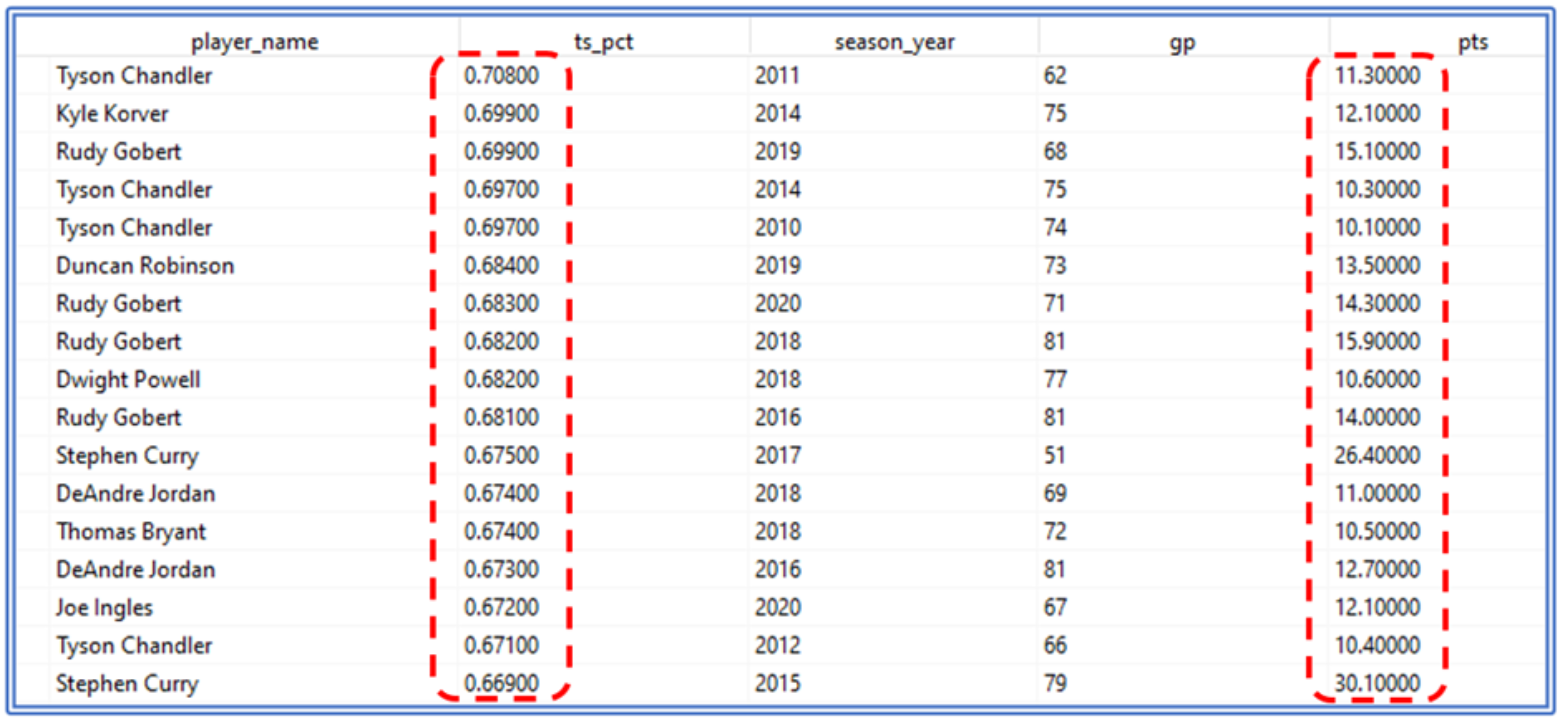
The next thing we would check is about the TS% column. TS% column represents the ”True shooting percentage”.
Perhaps by the name column definition- “True shooting percentage” matrix, all of you would think about players who are pure shooters or 3-point shooters, who plays as a guard position or scorer – like Steph Curry or Ray Allen, but this matrix gives us a different insight about the meaning of “True Shooting”.
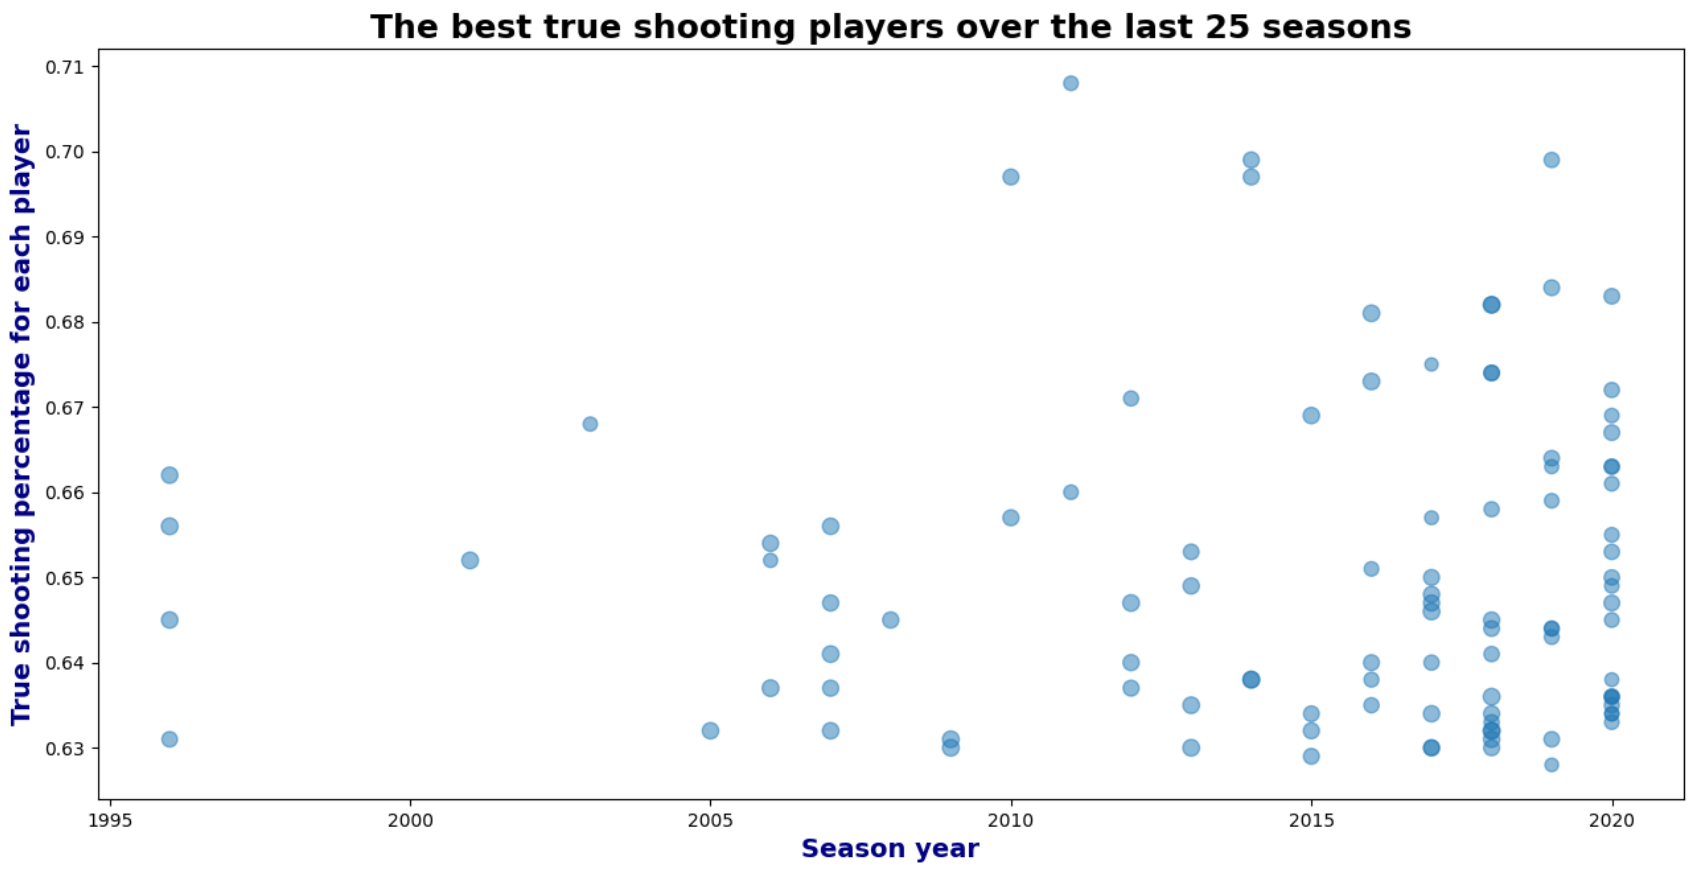
As we go over the output results above, we can find out who is in the top TS% category over the years. are big guys, such as : Rudy Gobert , Tyson Chandler and Deandre Jordan.
So, what “True Shooting” category really presents?
A “True Shooting” is a statistic that measures a player’s efficiency at shooting the ball. It is more accurate to calculate a player’s shooting than field goal percentage, free throw percentage and three - point field goal percentage.
TS% gives you an idea of how efficiently a player is producing points per shot (even free throw attempts). With this useful statistical measurement, managers can give a clearer meaning for gauge how a player is performing from the floor in totality.
TS% rewards players for the extra point generated by a made 3-pointer. It penalizes players who may shoot well from the field yet struggle at the line, or don’t take 3-pointers.
The advantage of this matrix is that it gives a more accurate calculation of a team’s or player’s shooting abilities compared to using separate statistics for field goal percentage, free throw percentage, and three-point field goal percentage.
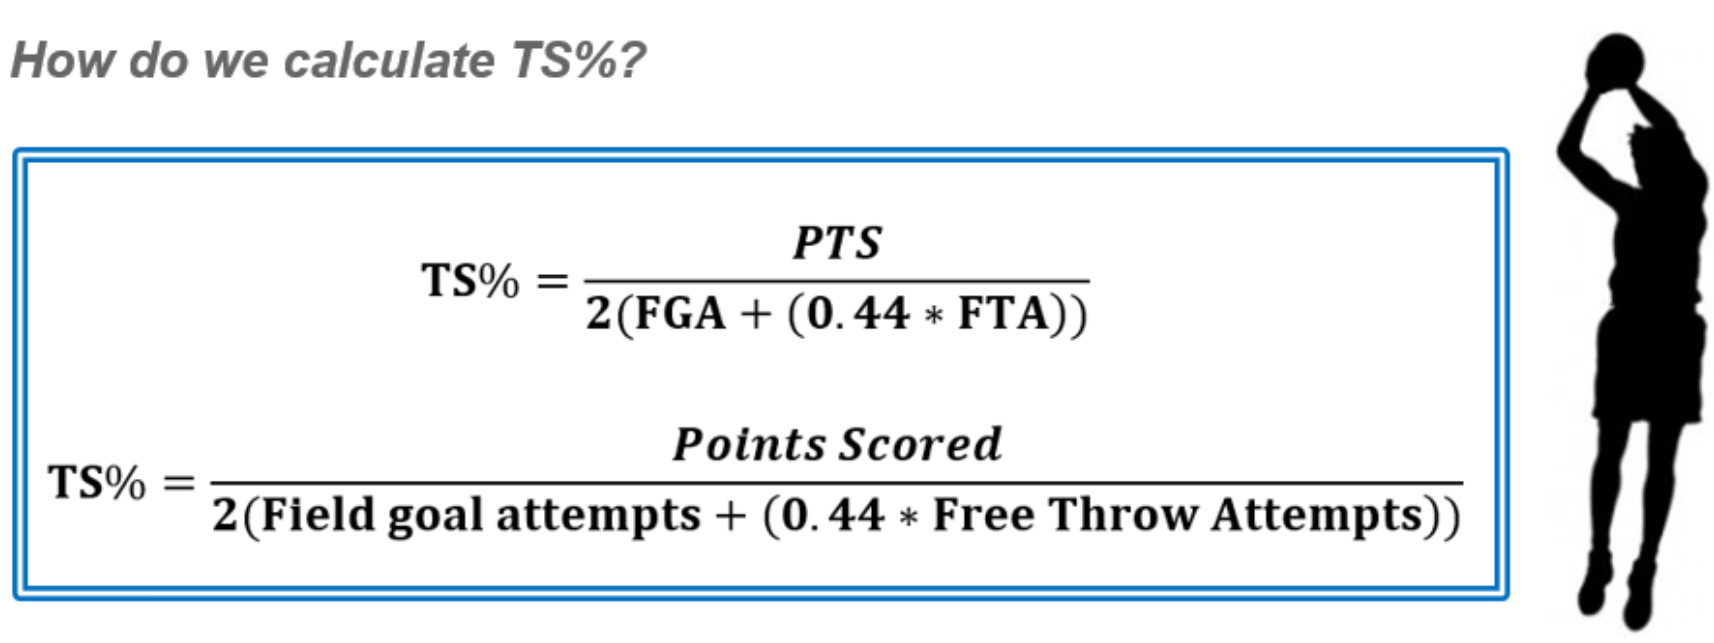
The calculation for this statistic is made using:
- The total points scored.
- The number of field goal attempts.
- The number of free throw attempts.
- What is the meaning of FTA?
The number of free throws that a player or team has attempted.
- What is the meaning of FGA ?
A team’s field goals attempted that a player has attempted while on the court.
TS% rewards players for the extra point generated by a made 3-pointer. It penalizes players who may shoot well from the field yet struggle at the line, or don’t take 3-pointers. Many years of analysis and research of players during matches show that this average TS% is rising. For the 2020/2021 season, the league average is 56.8%, while the so-called elite standard is almost above 60.0%.
Our next research we would be interested in diving deep is over the “Gp’’ column, taken from our dataset. This column is known as “Games played” - which means number of games in a season. Therefore, we decided to do a short research and find out :
Who are the players who played more than 8 seasons + scored more than 15 points each year and played at least more than 50 games in a season?
As we can see above we got a very short limited list, of elite players over the past 25 years, how were able to answer our questions.
All those players, ( Damian Lillard, LeBron James, Russell Westbrook, Chris Paul, Kevin Durant, John Wall and Kyrie Irving ) were able to to play more than 50 games each season, in a consistency of 9 or more years and also to score 15 points or more.
In addition we can notice the high percentage of each player’s games played over the entire season. For assets: For 9 years, Damian Lillard has an average game played in a season of almost 76 games. This result reflects 91.30% ( 76/83) games all his career.
Not so far from Damian’s percentage we got LeBron James and Russell Westbrook with 87% of total games played in their career. But if we will take a look at LeBron numbers, we can see an extraordinary detail. LeBron has played 18 years in the league and during his years he played 1,310 games, almost double the numbers of games Damian played.
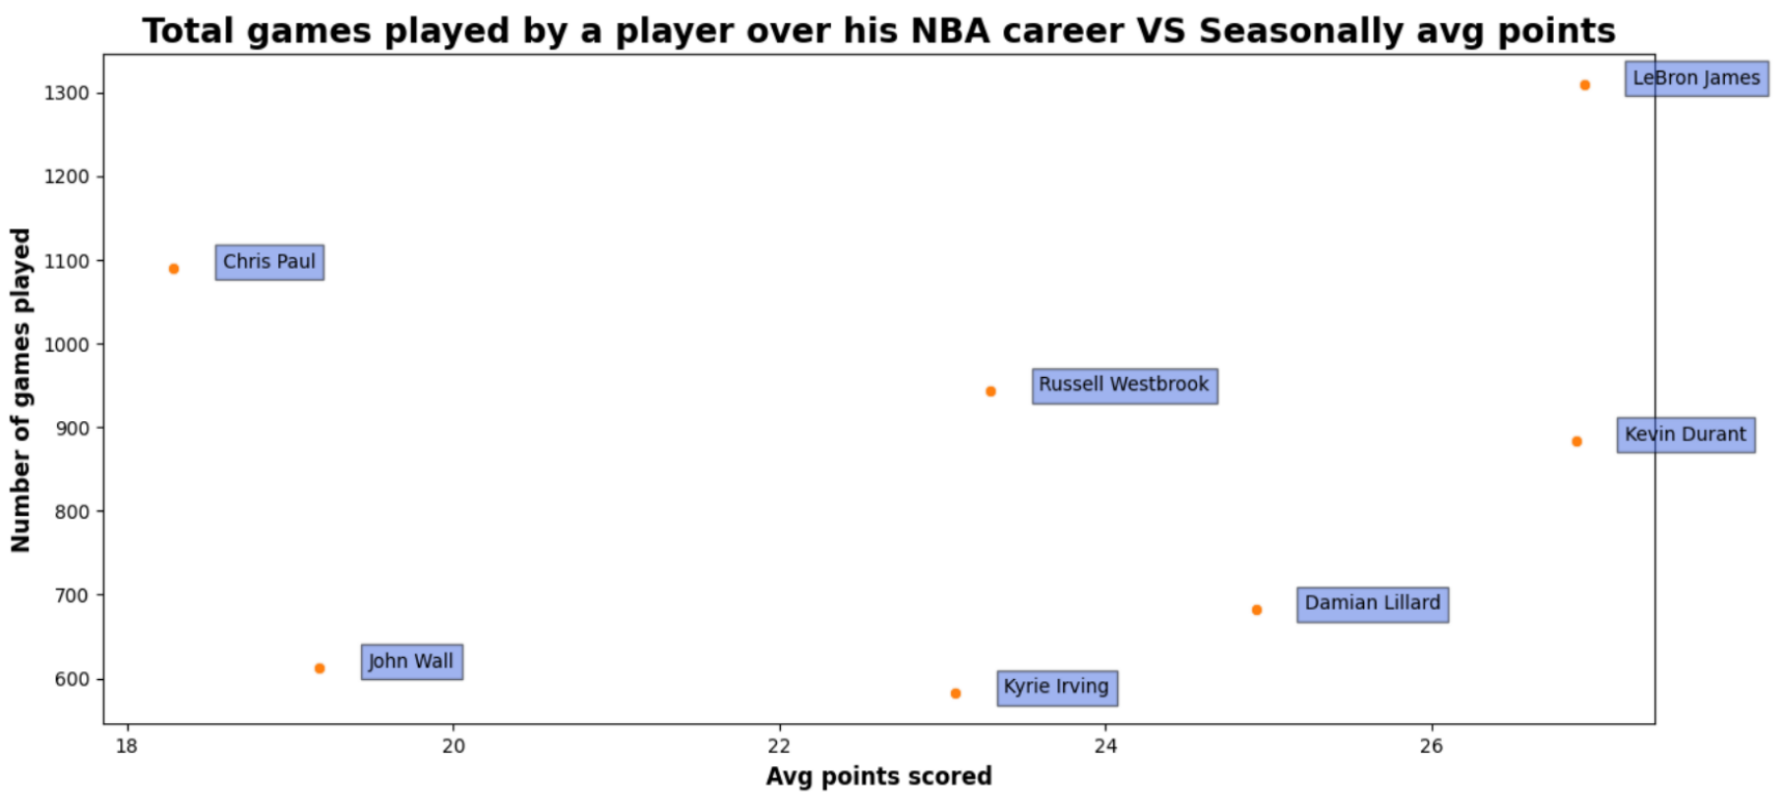
Furthermore, I decided to create a scatter chart, which would show us 3 elements epon those 7 players I mentioned above. The 3 elements are:
- Number of games played
- Average points scored
- Average games played in a season


