Shark Tank: Intro + Sharks' Investment Preferences (Part 1: Stats For Sharks)
Introduction
Today, we will be working with a dataset obtained from the Kaggle website. The dataset we are focusing on pertains to the popular TV show called “Shark Tank.” For those unfamiliar with the show, it features entrepreneurs who present their products or services to a panel of lenders known as “sharks” in exchange for financial investment. The entrepreneurs deliver presentations to the panel, seeking monetary backing in return for a percentage of their company.
This televised format, showcasing angel investment (where high net worth individuals invest their own money and time), provides valuable insights into discussions on equity, funding, valuation, and growth strategies.
The dataset we are working with contains information about the “Shark Tank” series aired on the ABC channel. It comprises 27 columns and 900 rows, forming a matrix of 900 * 27. Each row provides information about an aspiring entrepreneur venturing into the business world.
The column names include:
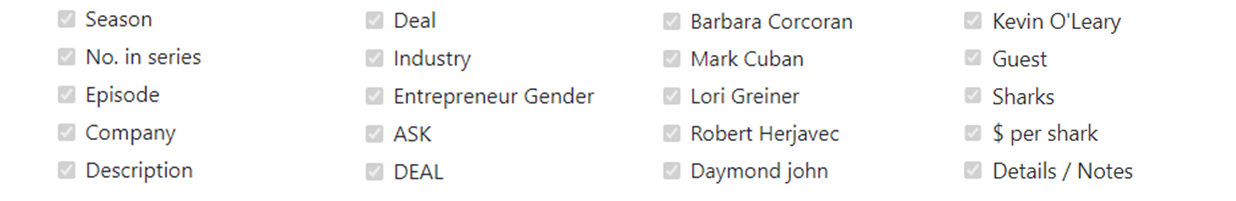
Sharks’ Preferred Industries for Investments
As we are aware, in each episode of every season, the sharks make multiple investment decisions to become stakeholders in various projects or companies. These companies operate in diverse industries such as toys and games, electronics, specialty food, and more.
In our upcoming analysis, we aim to gain a deeper understanding of the specific industries in which the sharks have chosen to invest with entrepreneurs. Furthermore, we have included the monetary amounts that each shark has decided to invest in these industries.
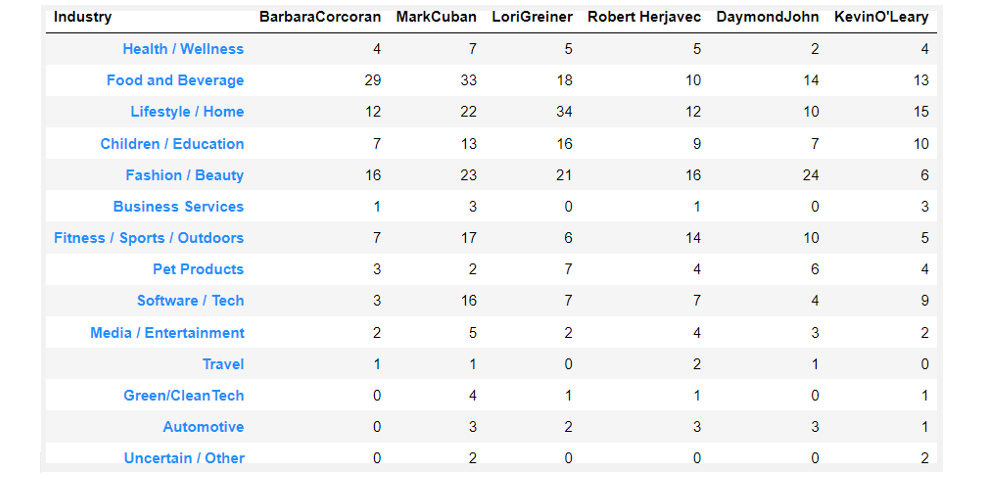
I would like to explore the investment patterns of each shark in different industries. By analyzing the data, I aim to determine which shark has a strong preference for investing in the technology sector, or who shows a particular interest in the food industry. Additionally, I want to identify any industries that the sharks tend to avoid investing in or where they show minimal interest. Moreover, I am curious to know which shark has made the highest number of investments in total. Hence, I have chosen to visualize these findings by creating a 3-D plot. The plot will incorporate three dimensions:
- The names of each shark will represent the first dimension.
- The names of the industries in which the sharks have made investments over the years will form the second dimension.
- The third dimension will represent the amount of investment made by each shark in a particular industry. Based on the animated chart we created, it is evident that the “Food and Beverage” industry stands out as one of the most appealing sectors for investment, according to the sharks. Additionally, two other industries, namely “Health” and “Lifestyle,” are also recognized by the sharks and hold considerable allure.
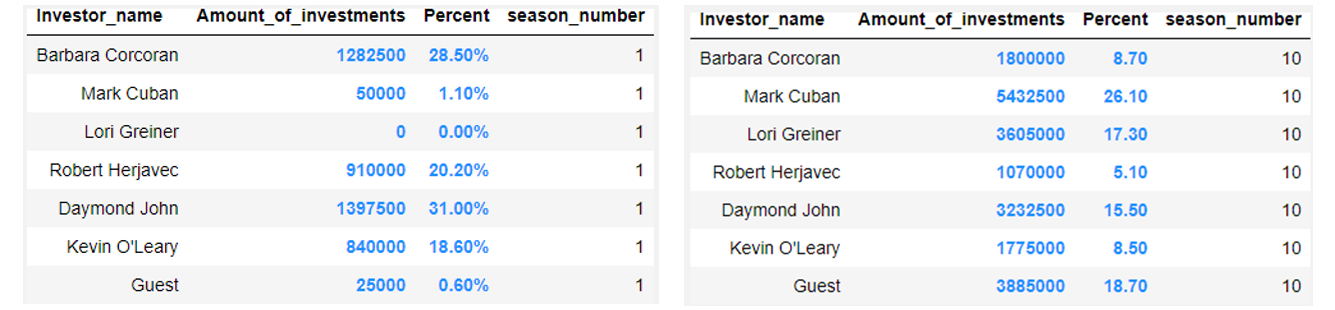
Investment Percentage: Sharks vs. Rest of the Panel in Each Season
One intriguing aspect we want to delve into is the level of investment made by each shark or guest on the show. Essentially, we aim to determine how much personal capital each individual is willing to invest in new entrepreneurial ideas. To shed light on this question, we conducted an analysis for each season, spanning from the first to the tenth. The chart below allows us to examine the percentage of investments made by a specific shark or guest in each season individual