Decoding Unicorns: What Sets Them Apart (Part 1: Unicorn Companies Series)
title: “What does the term ‘Unicorn’ really means?” Today we’ll start with a series of 6 posts. Each post will delve into an interesting research about financial side of investing. I am quite sure you all have already heard about it!
We are going to talk about “Unicorns”.
For some of you that aren’t familiar with this term “Unicorns”. I will explain it shortly.
What Is an Unicorn?
The term unicorn refers to a privately held startup company with a value of over $1 billion. It is commonly used in the venture capital industry. Unicorn investors tend to be private investors or venture capitalists, which means they are out of the reach of retail investors.
We will analyze a dataset taken from the kaggle website, which deals with “Unicorns”.
As we go over the dataset, we can notice the data includes 1,074 rows, each row contains different information for each company. There are 10 columns, and during the analysis we will manipulate the data and will add several columns. ( Starting point - 1,074*10= 10.740 cells )
These insights will be used to frame the present discussion as each one implies a different set of analytical perspectives.
In our first perspective, we will be talking about the data from an Economic point view, which means we will answer questions involve with:
- Amount of investment money has been poured into each country.
- The number of companies which were funded for each year.
- Names and amounts of companies who were able to pass the 1 billion dollar barrier each year.
- Finding out the “hot” industries in each country and cities.
- Exploring the locations of the 1 billion dollar companies over the globe.
After answering those kinds of questions we will dive into 2 other perspectives - Investor level , Company level.
In order to start testing the dataset we need to have a good grasp on the data. Furthermore, in this current post we will get the first insight taken from the dataset column and rows.
The names of the columns which are given from the kaggle resource raw data are:
| Field | Description |
|---|---|
| Company | Company name |
| Valuation | Company valuation in billions (B) of dollars |
| Date Joined | The date in which the company reached $1 billion in valuation |
| Industry | Company industry |
| City | City the company was founded in |
| Country | Country the company was founded in |
| Continent | Continent the company was founded in |
| Year Founded | Year the company was founded |
| Funding | Total amount raised across all funding rounds in billions (B) or millions (M) of dollars |
| Select Investors | Top 4 investing firms or individual investors (some have less than 4) |
In this dataset we have 1,074 companies located over the globe in each of the 6 continents: Asia, North America, Europe, Oceania, South America and Africa.
The dataset also contain a list to industries:
- Artificial intelligence
- Auto & transportation
- Consumer & retail
- Cybersecurity
- Data management & analytics
- E-commerce & direct-to-consumer
- Edtech
- Fintech
- Hardware
- Health
- Internet software & services
- Mobile and communication
- Travel
Each Company has a group of investors who invested an amount of money to contribute to the company’s success. In this dataset there are a total of 1,254 investors. An Investor can be a Private investor, an Investment management company , venture capital company( as known as VC ) or fund management company.
So let’s start with the exploring side.
First we would like to know how many companies are located in each county and city. By answering this question we possibly will be able to find there are any correlation and connection to the amounts cash poured into each country/ city, for example: If in the US we have 500 companies ( dataset contains 1074 companies), it is possible that ~50% of our investors will poured their cash into the exact cities or countries.
Now, I will start checking if our hypothesis is correct.
Step 1 : finding the number of unicorns in each country
Let’s add our written code:
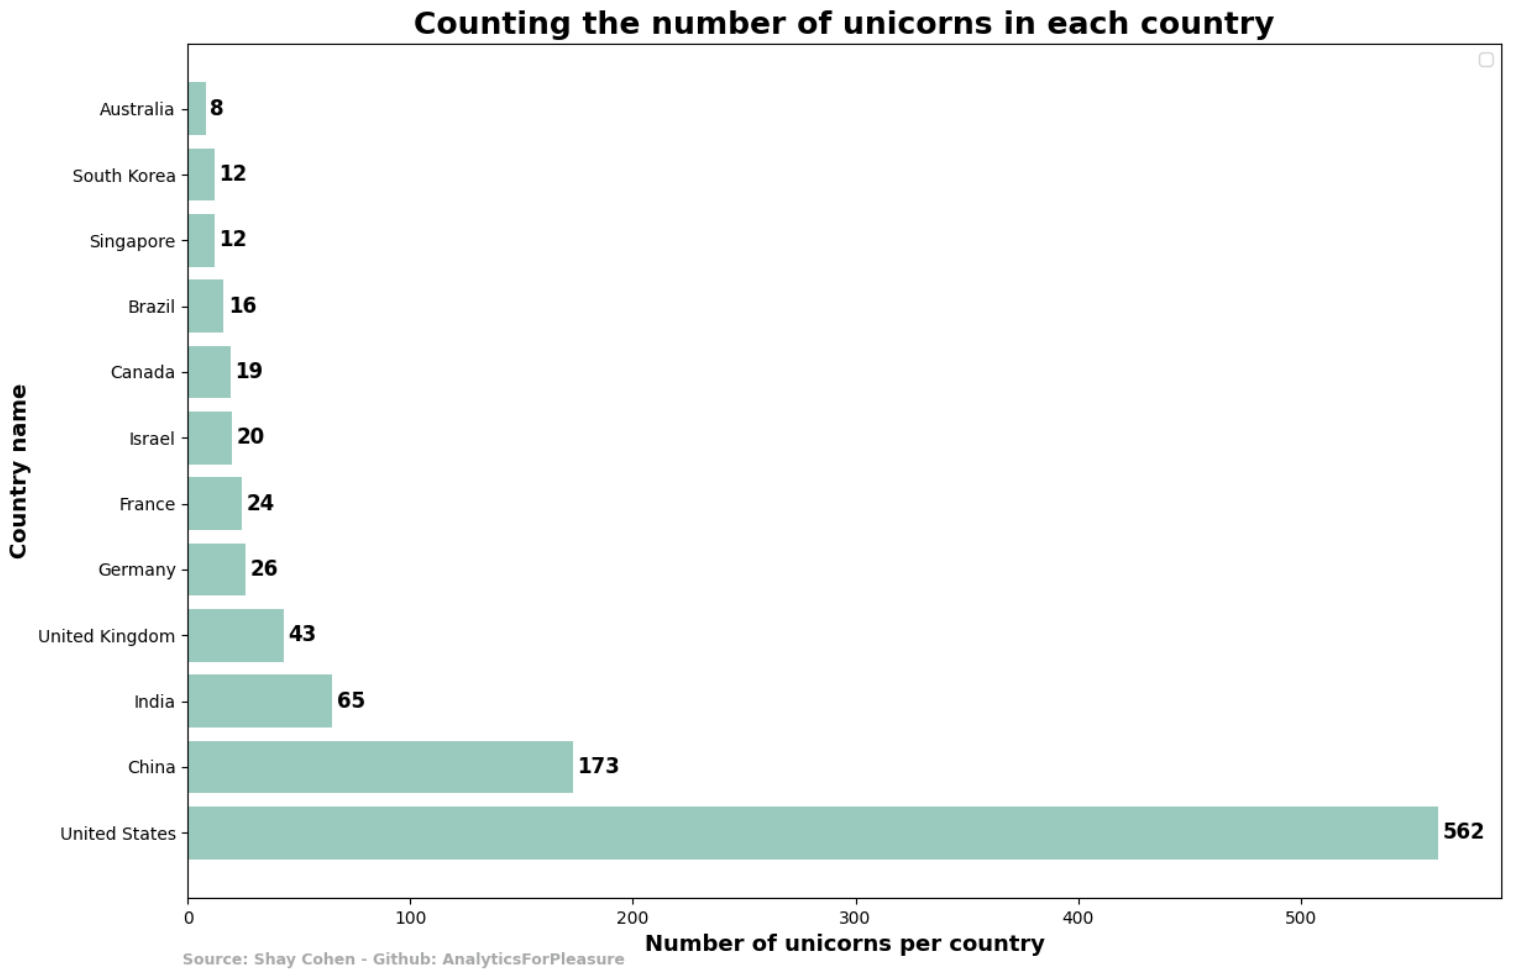
We can see more than half of the companies are located in the US. In second place on top, we can see then chinese companies - with 173 companies. Afterwards, our examination reveals that India and the United Kingdom take the third and fourth place, with 65 companies and companies in correspondence.
Step 2: Finding the number of unicorns in each city
Let’s add our written code:
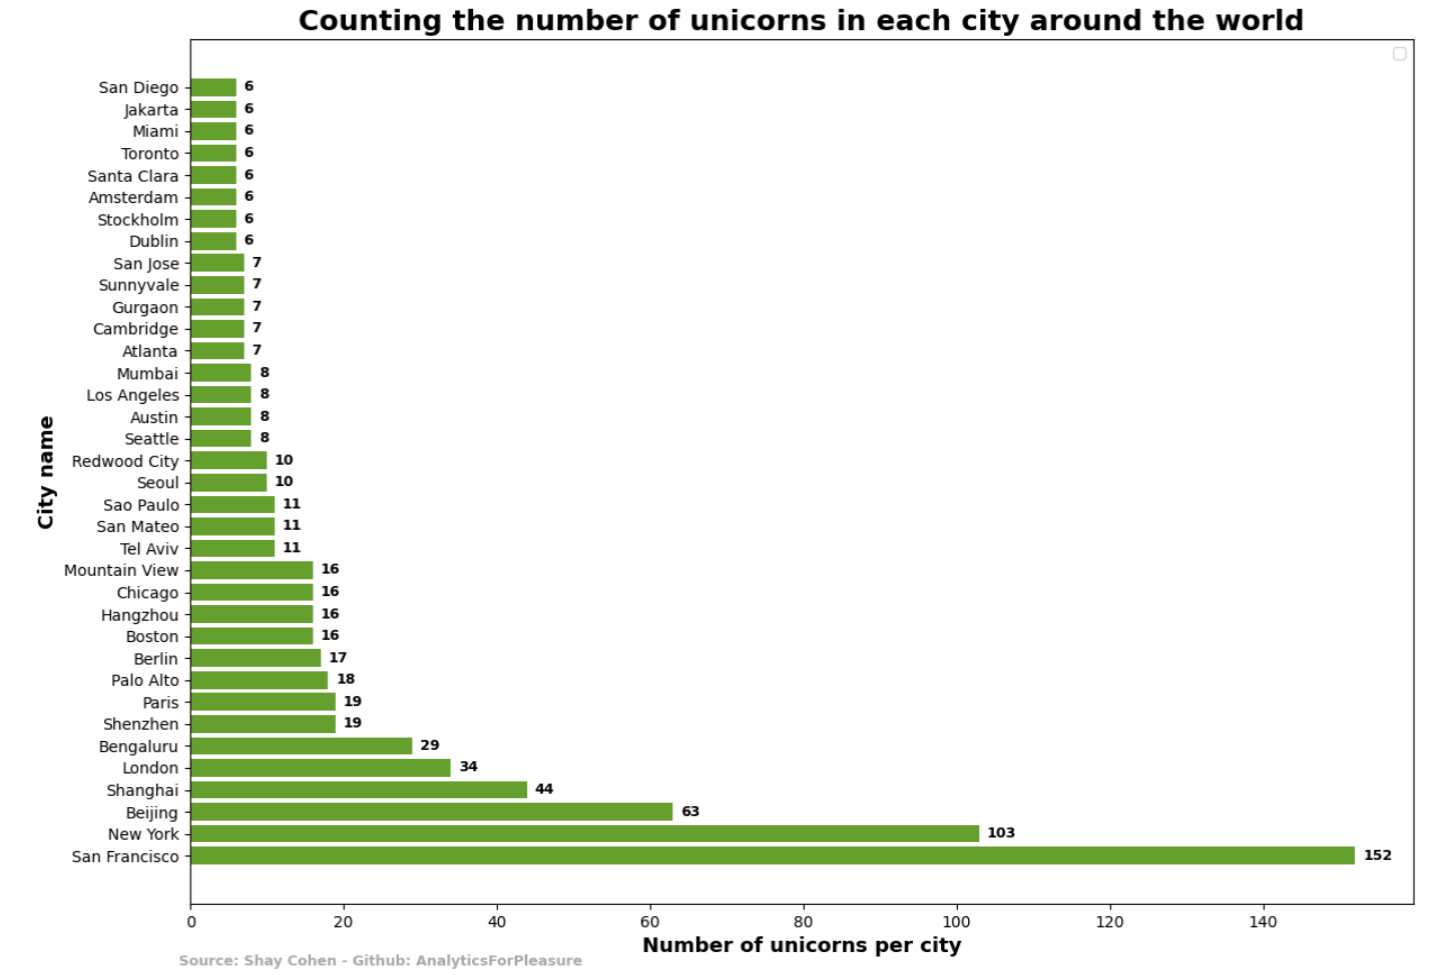
As we get the output above, we can notice a big difference between the leading cities to the rest. San Francisco leads by far over the unicorn companies who are located in this city with 152 unicorn companies. In the second place we can see 103 unicorn companies located in new - york. We can see in this chart a massive amount of cities located in the US, such as: San Francisco, New - York, Palo Alto, Chicago, Los Angeles, Seattle, Cambridge, Atlanta, sunnyvale.
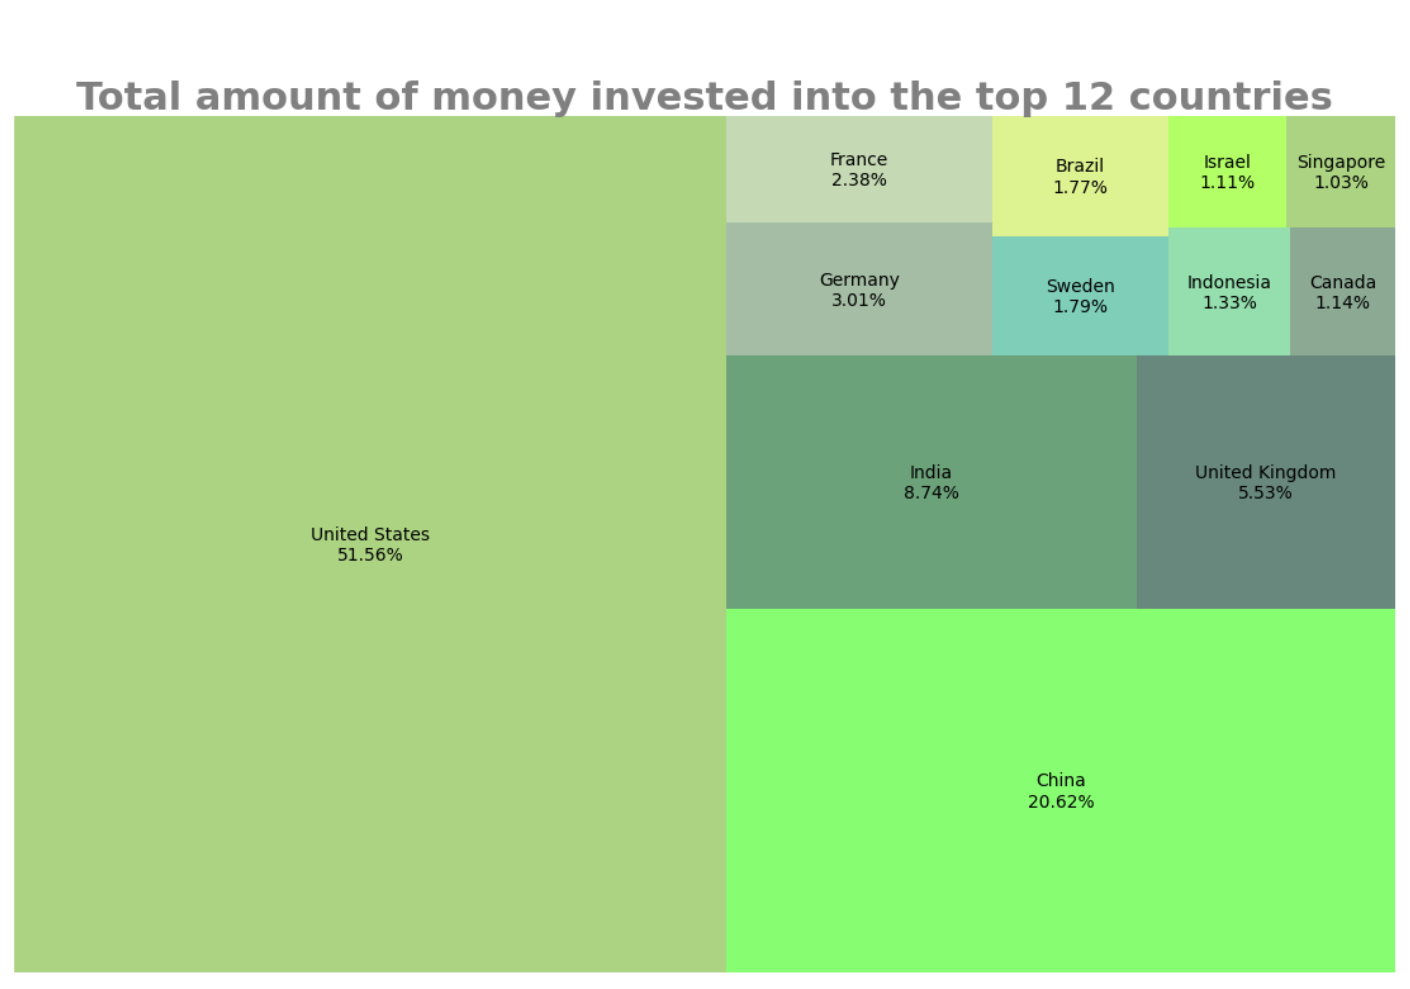
Now, we will check out the other side - the side of investors who poured their money into the country. We can see 51.5% of all investments went to the US. more the ⅕ total investments went to china.
This result above we got by writing this code: