School Shooting Analysis: Tableau Edition (Part 2 of 3)
Today, I’m taking a brief detour from my usual Python-centric writing to delve into data visualization with Tableau software. To kick off this exploration, I’ve selected an intriguing dataset from Kaggle titled ‘Shooting School’.
This dataset originates from the K-12 School Shooting Database (K-12 SSDB), which meticulously documents instances involving the brandishing, firing, or impact of bullets on school property, irrespective of the number of victims, time of occurrence, or day of the week. After downloading the data, I conducted basic Excel queries to organize the information dispersed across multiple sheets.
For those interested, I recommend reviewing their research methodology to gain insight into their data collection and compilation process from various sources. This dataset offers insights into school shooting incidents spanning the past five decades, commencing from May 1, 1970, along with the associated relative risk of fatality or injury in such events.
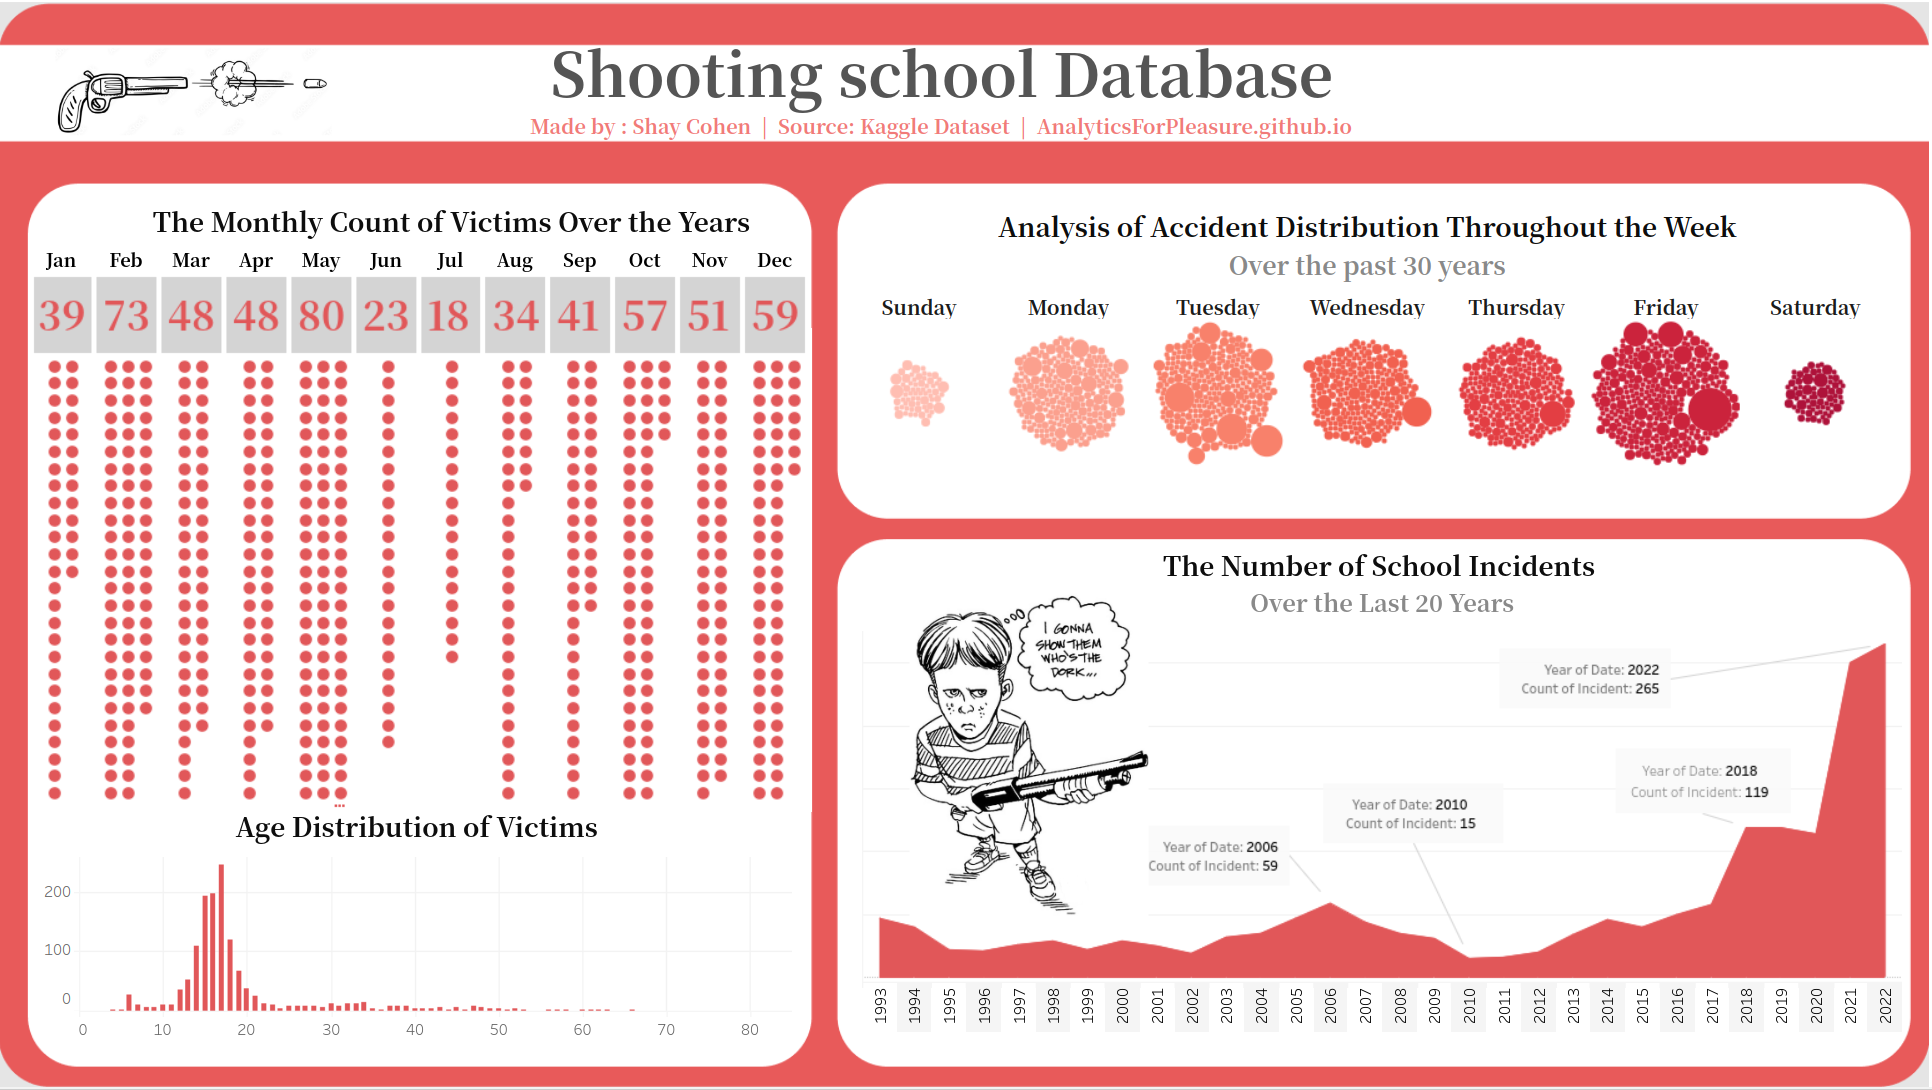
Here’s a quick preview of the Tableau output dashboard I’ve created:
This data source comprises four datasets that we will explore:
- The ‘Incident’ dataset
- The ‘Shooter’ dataset
- The ‘Victim’ dataset
- The ‘Weapons’ dataset”
To construct a dashboard, I focused on the first three datasets: Incident, Shooter, and Victim. After conducting several analyses, I selected four key topics to feature on the dashboard.
The initial chart I opted to include utilizes data extracted from the “Incident” dataset. My objective was to identify the weekday with the highest frequency of incidents over the last 30 years. To visualize this information, I employed a bubble chart where each bubble represents the number of victims involved in each incident (identified by incident ID) within the past 30 days.
Observing the chart, we can discern that each weekday is represented by a prominent bubble, indicating a specific incident. The size of each bubble, grouped by weekday, correlates with the number of victims involved on that particular day. Moreover, it is evident that the majority of school shooting incidents occur on Fridays and Tuesdays over the past 30 years. Conversely, the occurrence of incidents is notably lower on Saturdays and Sundays, which aligns with the absence of school days.
The second area of research I’d like to explore pertains to the frequency of incidents that have occurred over the past three decades, spanning from 1993 to 2023. As shown in the chart below, a notable shift is observed, particularly since 2010. In 2010, the number of school shooting incidents in the US amounted to a mere 15 occurrences. Subsequently, there has been a stark uptick in the incidence of such incidents. By 2022, this figure skyrocketed to its peak at 265 incidents, marking a surge of over tenfold in cases over the preceding decade.
Let’s dive a bit deeper into the data and explore the number of victims each month over the years. Looking at the chart on our dashboard, it’s clear that February and May have consistently had the highest number of victims from school shootings. Over the past 50 years, February saw 73 victims, while May had 80 victims.
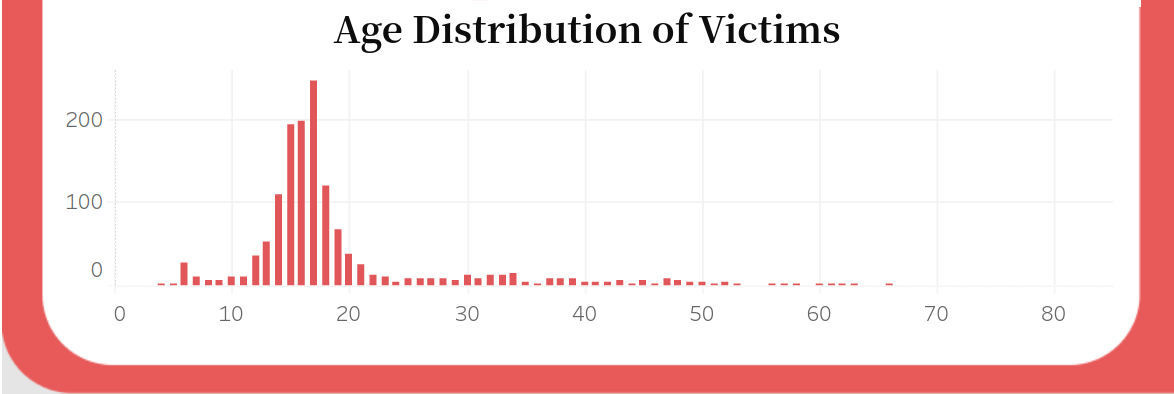
The last thing I’m curious about is the age distribution of the victims. I’m wondering which age group has seen the most victims over the past 50 years. Taking a closer look at the chart below, it’s evident that the majority of victims fall within the age range of 15 to 18 years old.


