Analyzing the Price Trends of Dairy Products in Israel
Today, our analysis extends to Kaggle-derived data, providing insights into the pricing trends of food items in Israel spanning several decades.
In the initial post, the focus was on vegetables, fruits, meat, fish, and chicken, revealing noteworthy price jumps every five years. Now, I aim to explore a different category of products—specifically, the pricing dynamics of dairy products in Israel. Consequently, I’ve chosen six items to investigate, ordered based on their price differences over a 15-year period.
The selected dairy products under examination are:
- Hard yellow cheese from cow’s milk (100 g)
- Leben (200 ml)
- Cottage cheese (250 grams)
- Soft white cheese (250 grams)
- Margarine for spreading in a cup (250 grams)
- Natural yogurt in a plastic container (200 ml)
To analyze this, I wrote a code to obtain the output result. Here is the code I implemented:
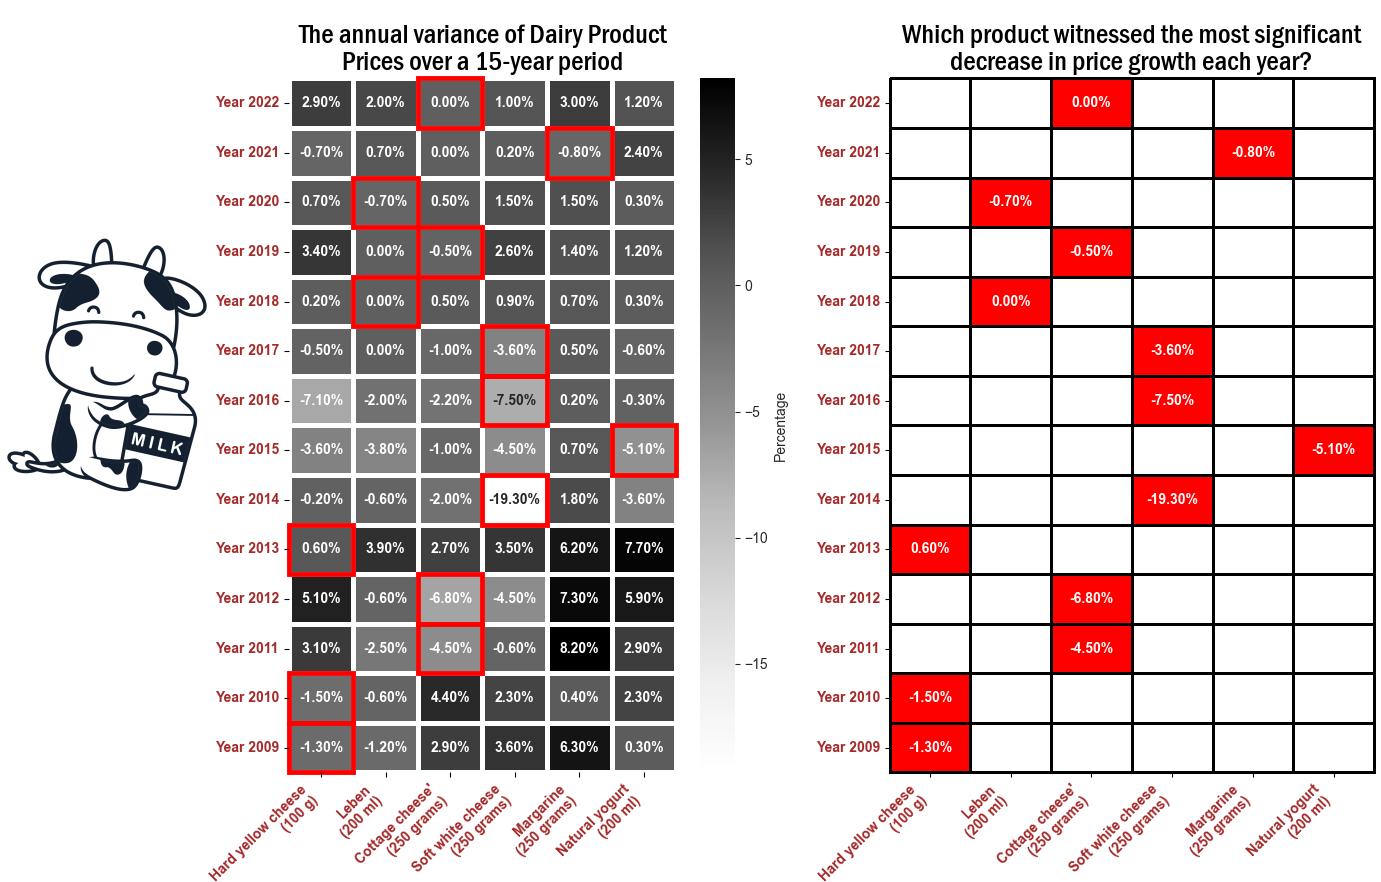
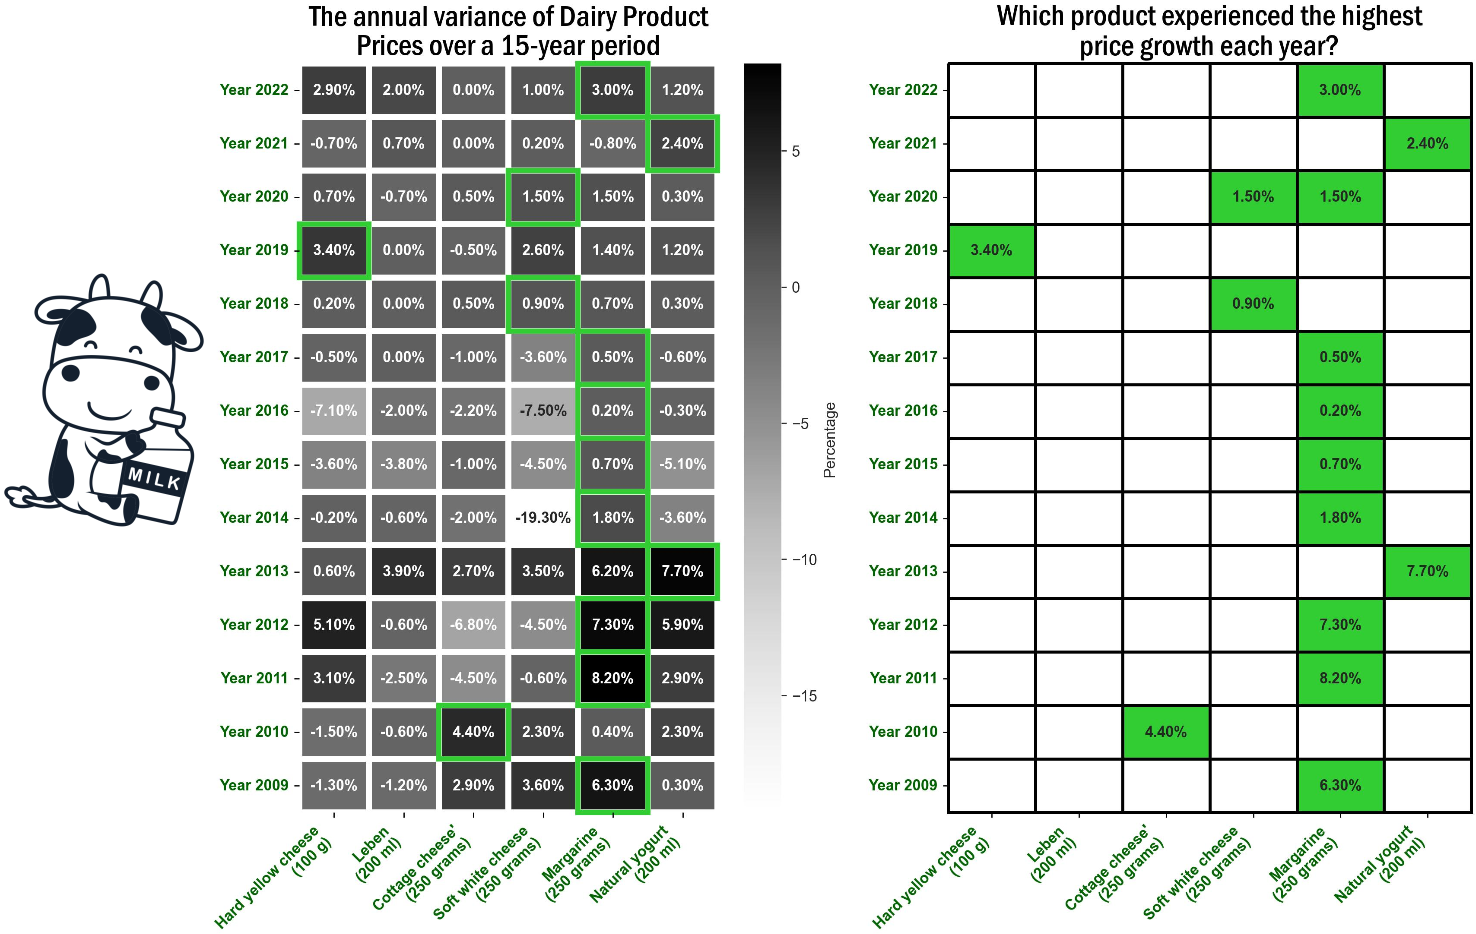
Therefore, in the chart displayed below, I have analyzed the performance of these dairy products, plotting the data on a scale from the year 2009 to 2022. The chart on the left, titled “The Annual Variance of Dairy Product Prices over a 15-Year Period,” presents a 14*6 matrix. Each matrix cell provides information on the percentage increase in price between the current price of a specific dairy product and the price of the same dairy product in the previous year.
Additionally, for each contiguous year, a green rectangle has been added, indicating the highest percentage among the 6 products for that specific year.
The chart on the right, under the title “Which Product Experienced the Highest Price Growth Each Year?” offers a clearer depiction of the dairy product with the most significant price increase in a given year. For instance, it answers questions like, “Which dairy product had the highest price increase over the entire period?” The answer, as illustrated, is “Margarine (250 grams)”. Similarly, if one wonders which dairy product held the title for the most consecutive years, the answer is also “Margarine (250 grams)”, observed between the years 2014 and 2017.
On the other hand, when examining which dairy product was less impacted by price increases over the 14-year period compared to others, “Leben (200 ml)” stands out. The Leben product experienced price increases only twice during this period, specifically in 2013 and 2022, at 2% and 3.9%, respectively.
Let’s now shift our focus to the next chart, which takes us in the opposite direction. Here, I aim to illustrate the decline percentage for the same dairy products over the same period. For each year, a red rectangle has been incorporated, denoting the lowest corresponding percentage among the six products for that specific year.
Moving to the right side chart, under the title “Which Product Witnessed the Most Significant Decrease in Price Growth Each Year?”, we can draw several conclusions and insights. Firstly, a notable observation is the substantial percentage decline of “Soft white cheese (250 grams)” in 2014, experiencing a significant drop of 19.3% during that year.
Another noteworthy point is that between 2014 and 2017, the price of the same “Soft white cheese (250 grams)” product resumed its increase after a substantial decline.
Delving deeper into the chart, focusing on “Cottage cheese (250 grams)” a distinct change in trend is apparent between 2011 and 2012. During these years, there is a noticeable decline of -4.5% in 2011 and -6.8% in 2012. Deciphering this mystery, I found the reason for this trend shift — the “Cottage cheese boycott” ( As mentioned - here) which sparked a public debate on the high cost of living in Israel.