What are the salaries for men and women in PhD positions? (Part 1: Compensation Analytics)
Today, we will delve into an insightful analysis of a dataset sourced from Kaggle titled “Salary by Job Title and Country”. This dataset presents a comprehensive view of salary information across various industries and global regions. Key columns include job titles, salary amounts, age, years of experience, and education levels.
Our initial exploration aims to answer the question: What specific roles do individuals with a Ph.D. typically occupy? Moreover, we seek to discern whether male Ph.D. holders gravitate towards different positions compared to their female counterparts with a Ph.D. Once we unravel the answers to these inquiries, our next focus will be on identifying potential gender-based salary disparities.
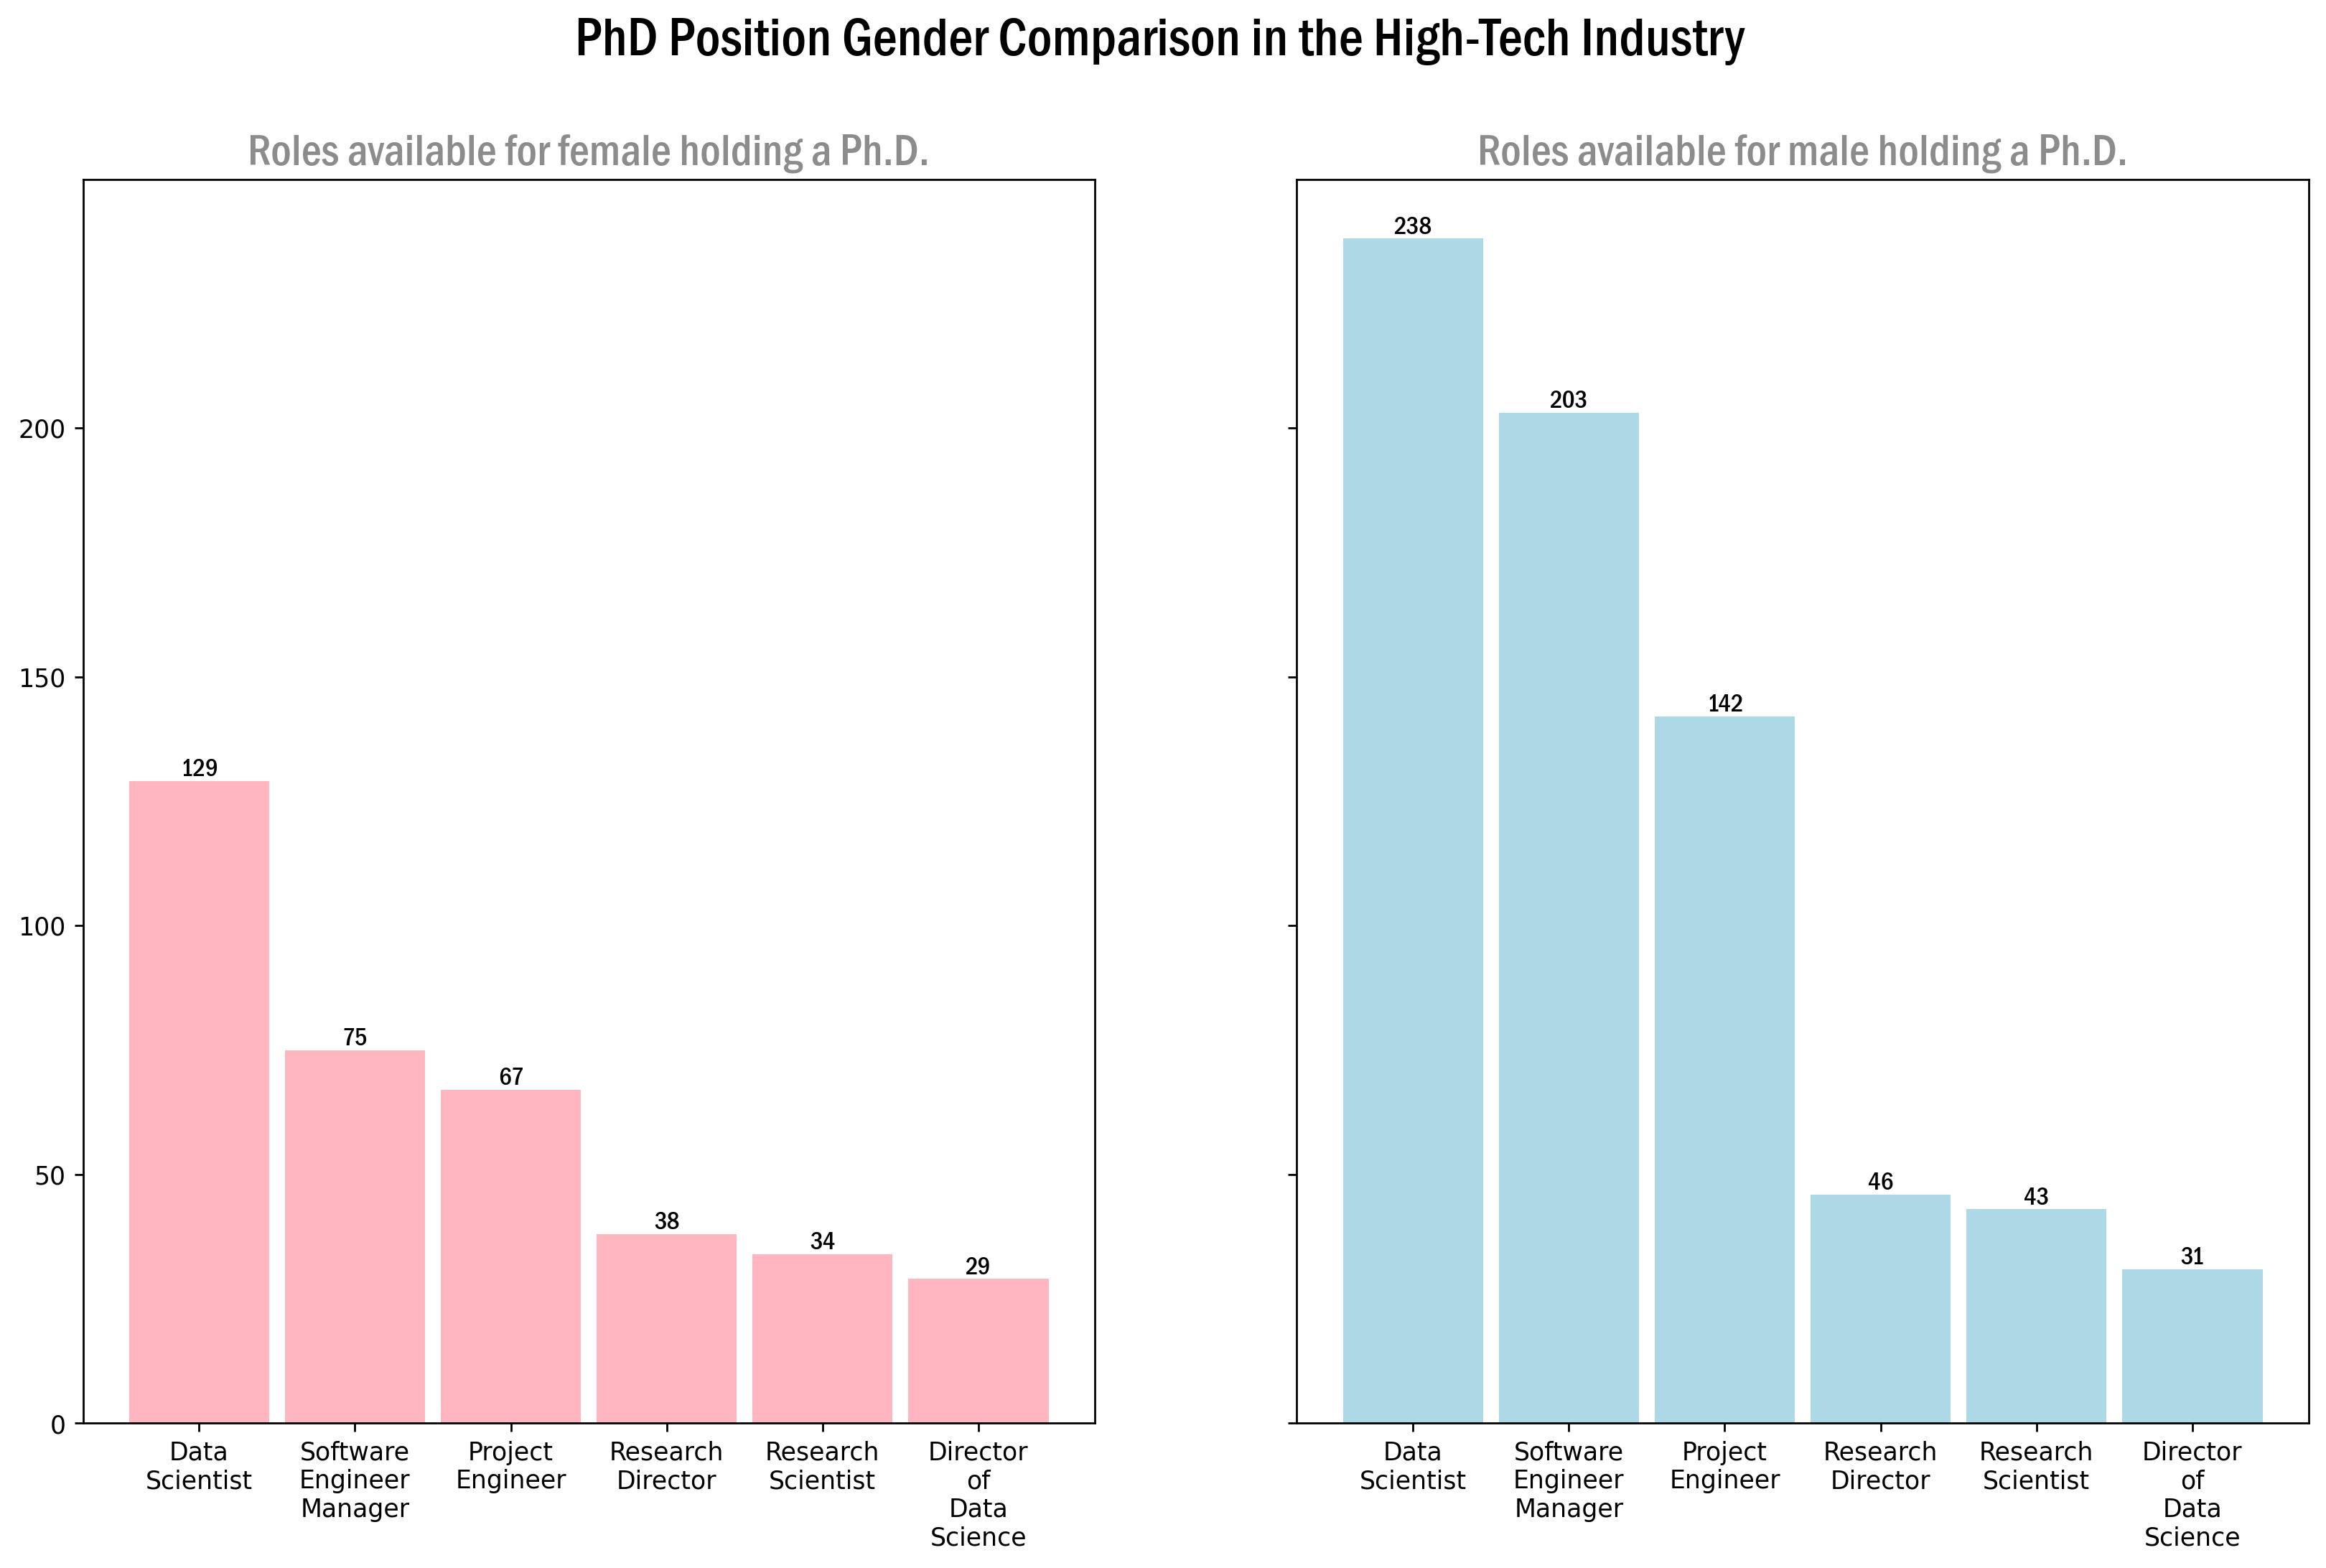
The chart results above highlight a notable absolute difference in the number of male and female roles in specific positions, particularly Data Scientist, Software Engineer Manager, and Project Engineer. For Data Scientists, the male count is 238, significantly exceeding the female count of 129, resulting in a 46% difference. Similarly, in the case of Software Engineer Managers, there are 203 males compared to 75 females, reflecting a 73% difference. Likewise, for Project Engineers, there are 142 males versus 67 females, indicating a 53% difference. The evident gender distribution disparity across these roles emphasizes the importance of careful consideration and examination within these professional domains.
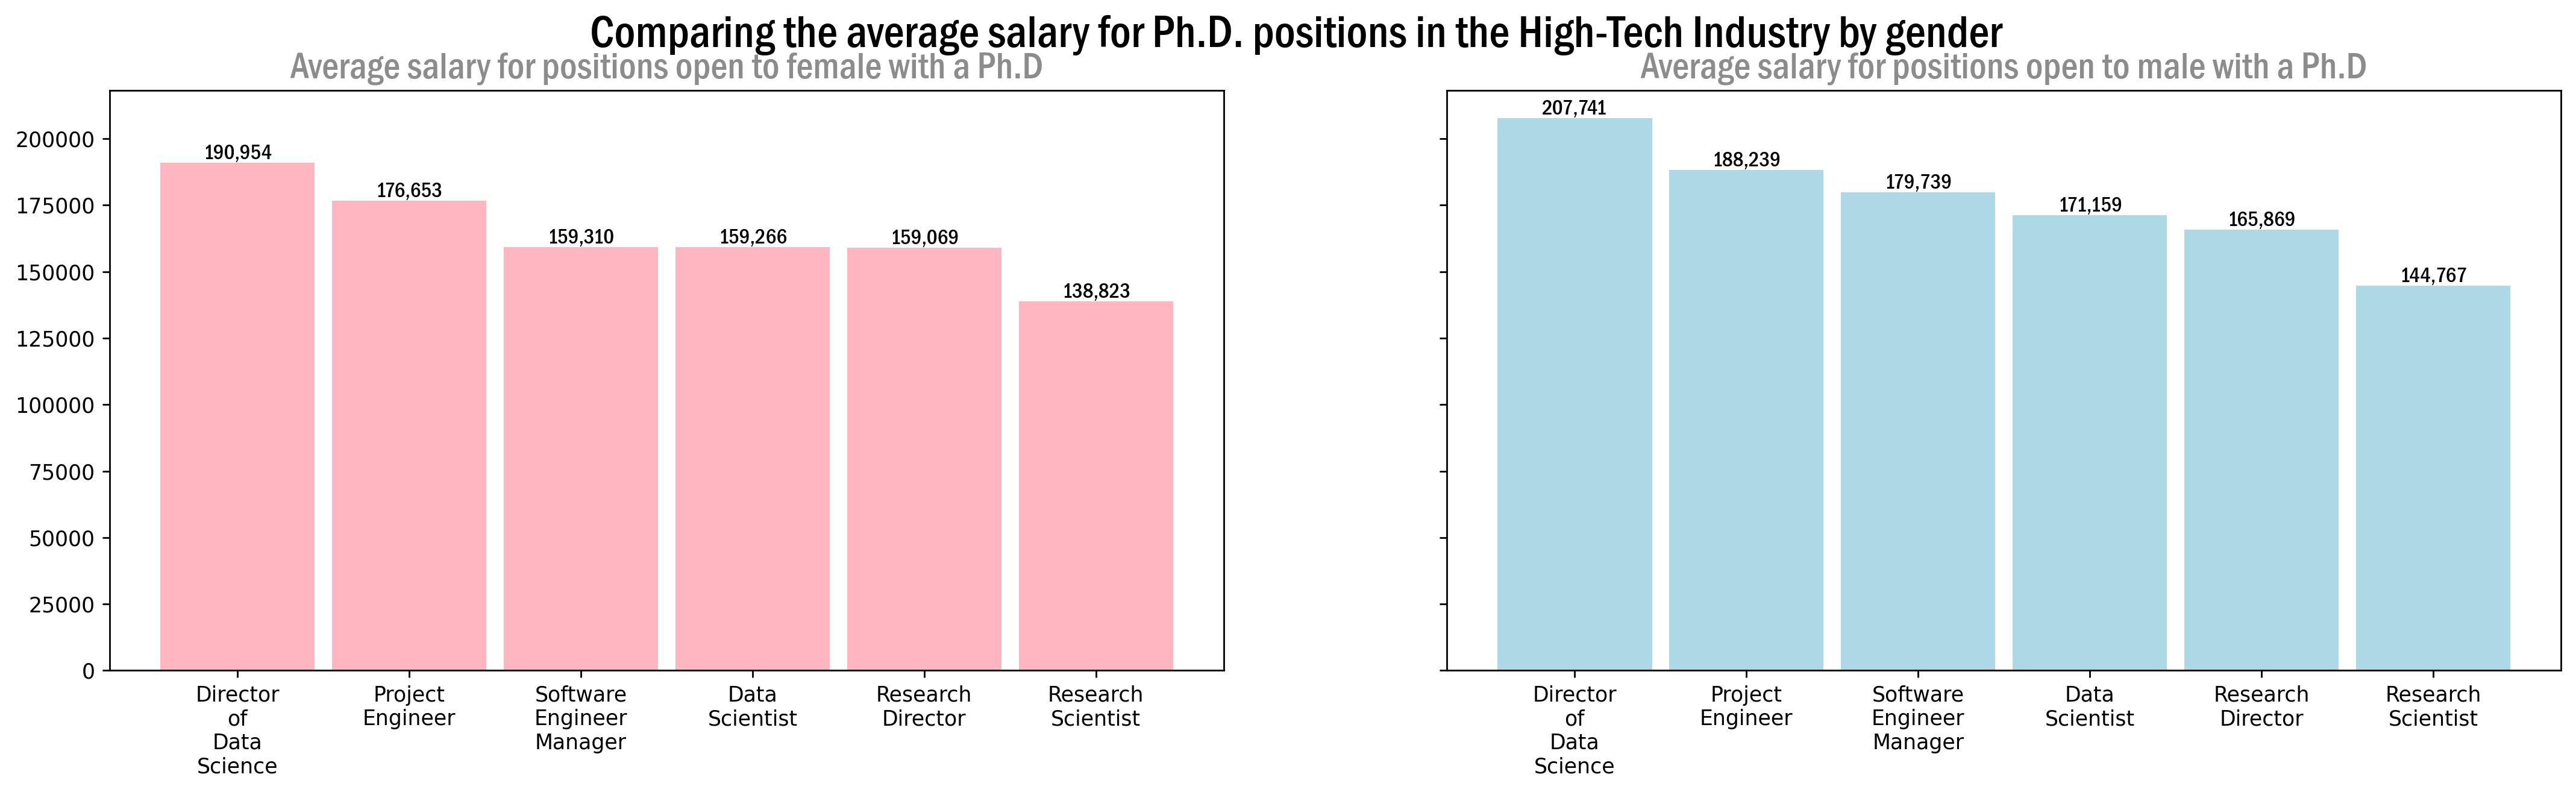
Determine the mean salary for each position within every group
After identifying a limited selection of the top positions for both males and females, our objective is to calculate the average salary for each position within these groups. Additionally, we will further categorize salaries by gender, comparing the earnings of males versus females within each job category.