Dot Plot Analysis: Salary and Age Dynamics by Job Position (Part 3: Compensation Analytics)
Exploring Salary and Age Patterns Across Job Titles with Dot Plots
In our upcoming research, we aim to explore the distribution of salaries for various job positions in comparison to the age distribution within the same roles, utilizing a dot plot. In the chart provided below, the X-axis represents salary ranges, and the Y-axis corresponds to age ranges specific to each job.
To enhance our analysis, two lines have been incorporated: a vertical line indicating the average age for a particular job and a horizontal line indicating the average salary. The points where these lines intersect create distinct squares, each revealing unique insights:
- The upper-left square shows the lowest salaries for the youngest workers.
- The upper-right square highlights the highest salaries for the youngest workers.
- The lower-left square signifies the lowest salary range for the oldest workers.
- The lower-right square signifies the highest salary range for the oldest workers.
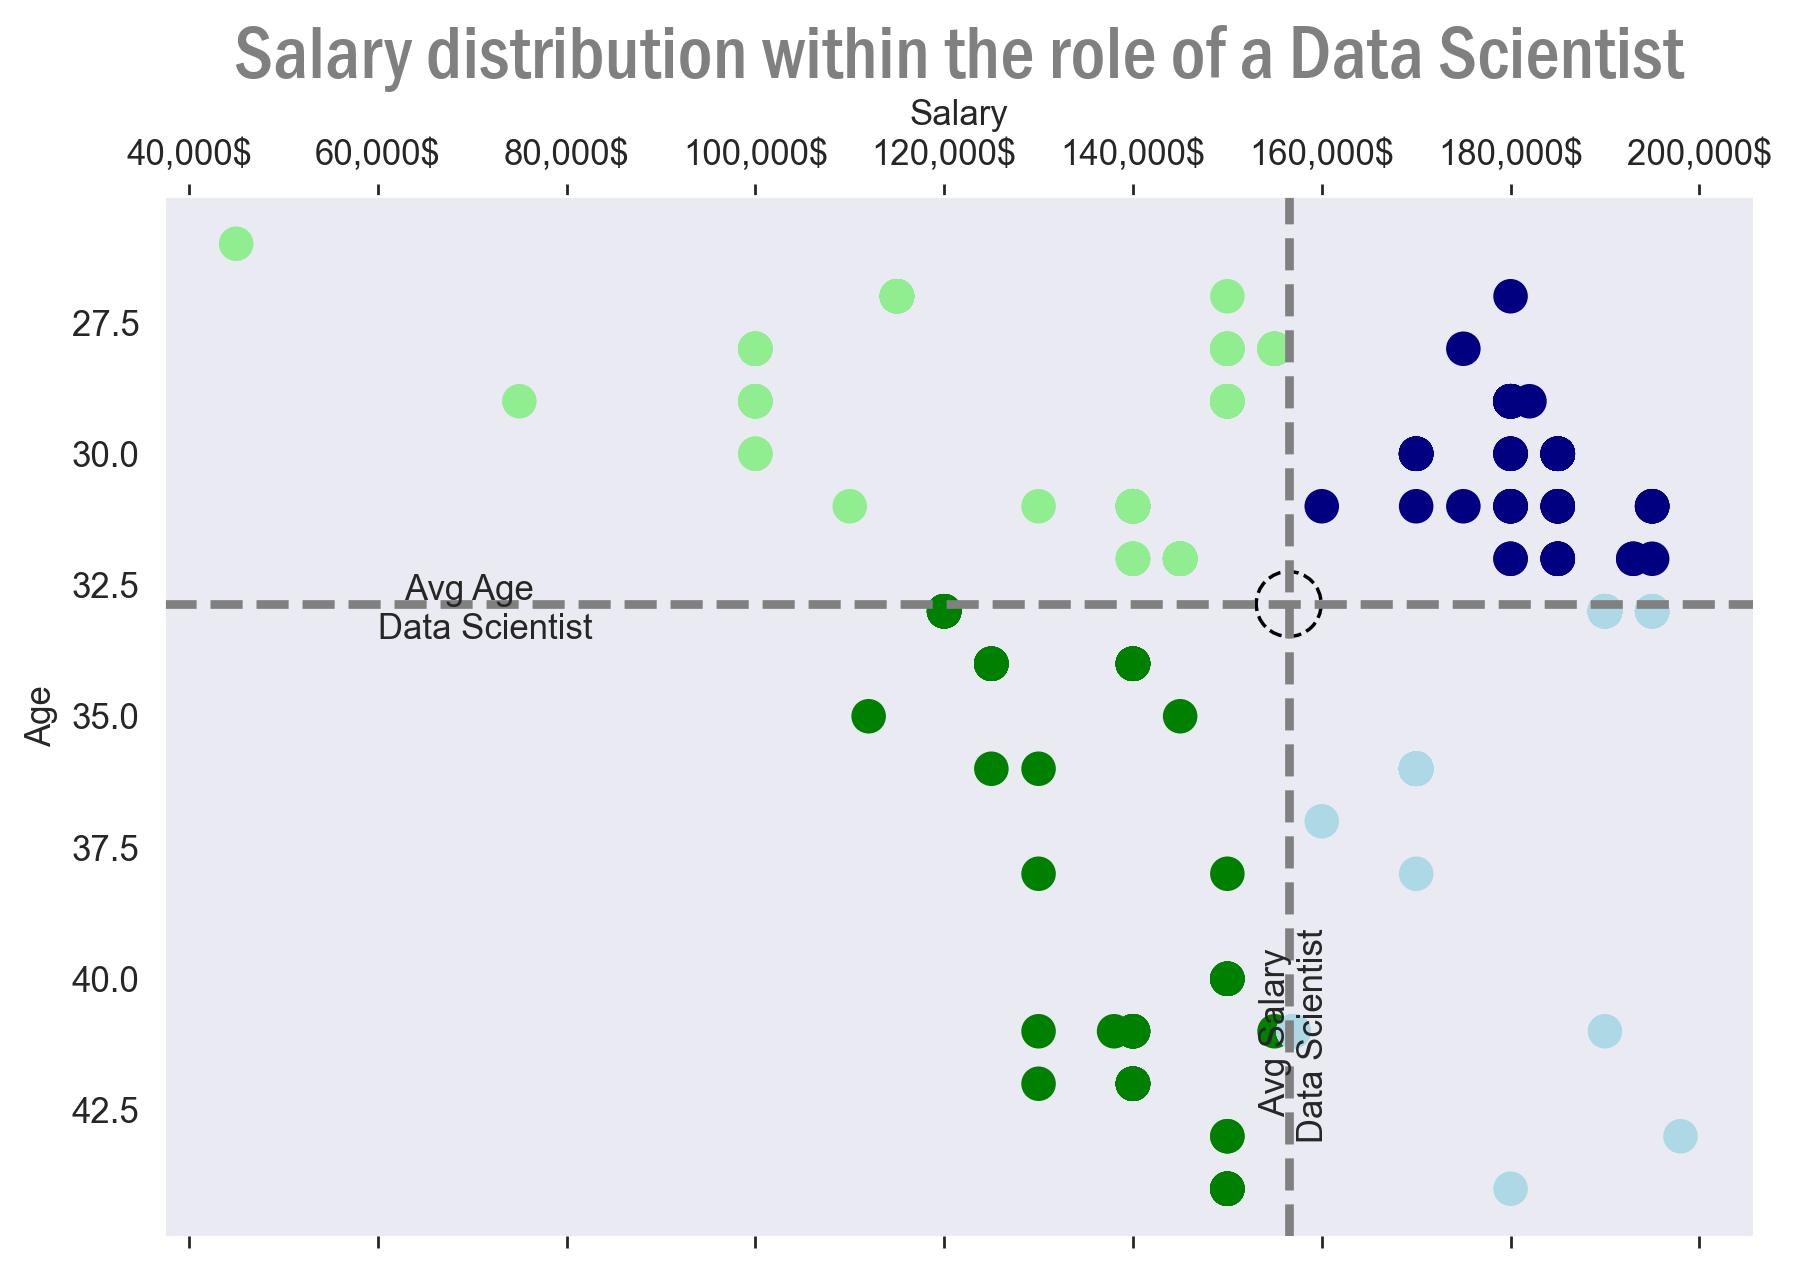
As we delve into the details, examining the initial chart for the role of a “Data Scientist”, we observe the intersection point of the two lines. This point represents an average age of 33 years and an average salary of $157,000 for Data Scientists. Additionally, there is a noticeable concentration of workers under 33 years old earning more than the average salary. Moreover, a high density is observed in the lower-left corner, indicating that salaries do not decrease significantly as workers age.
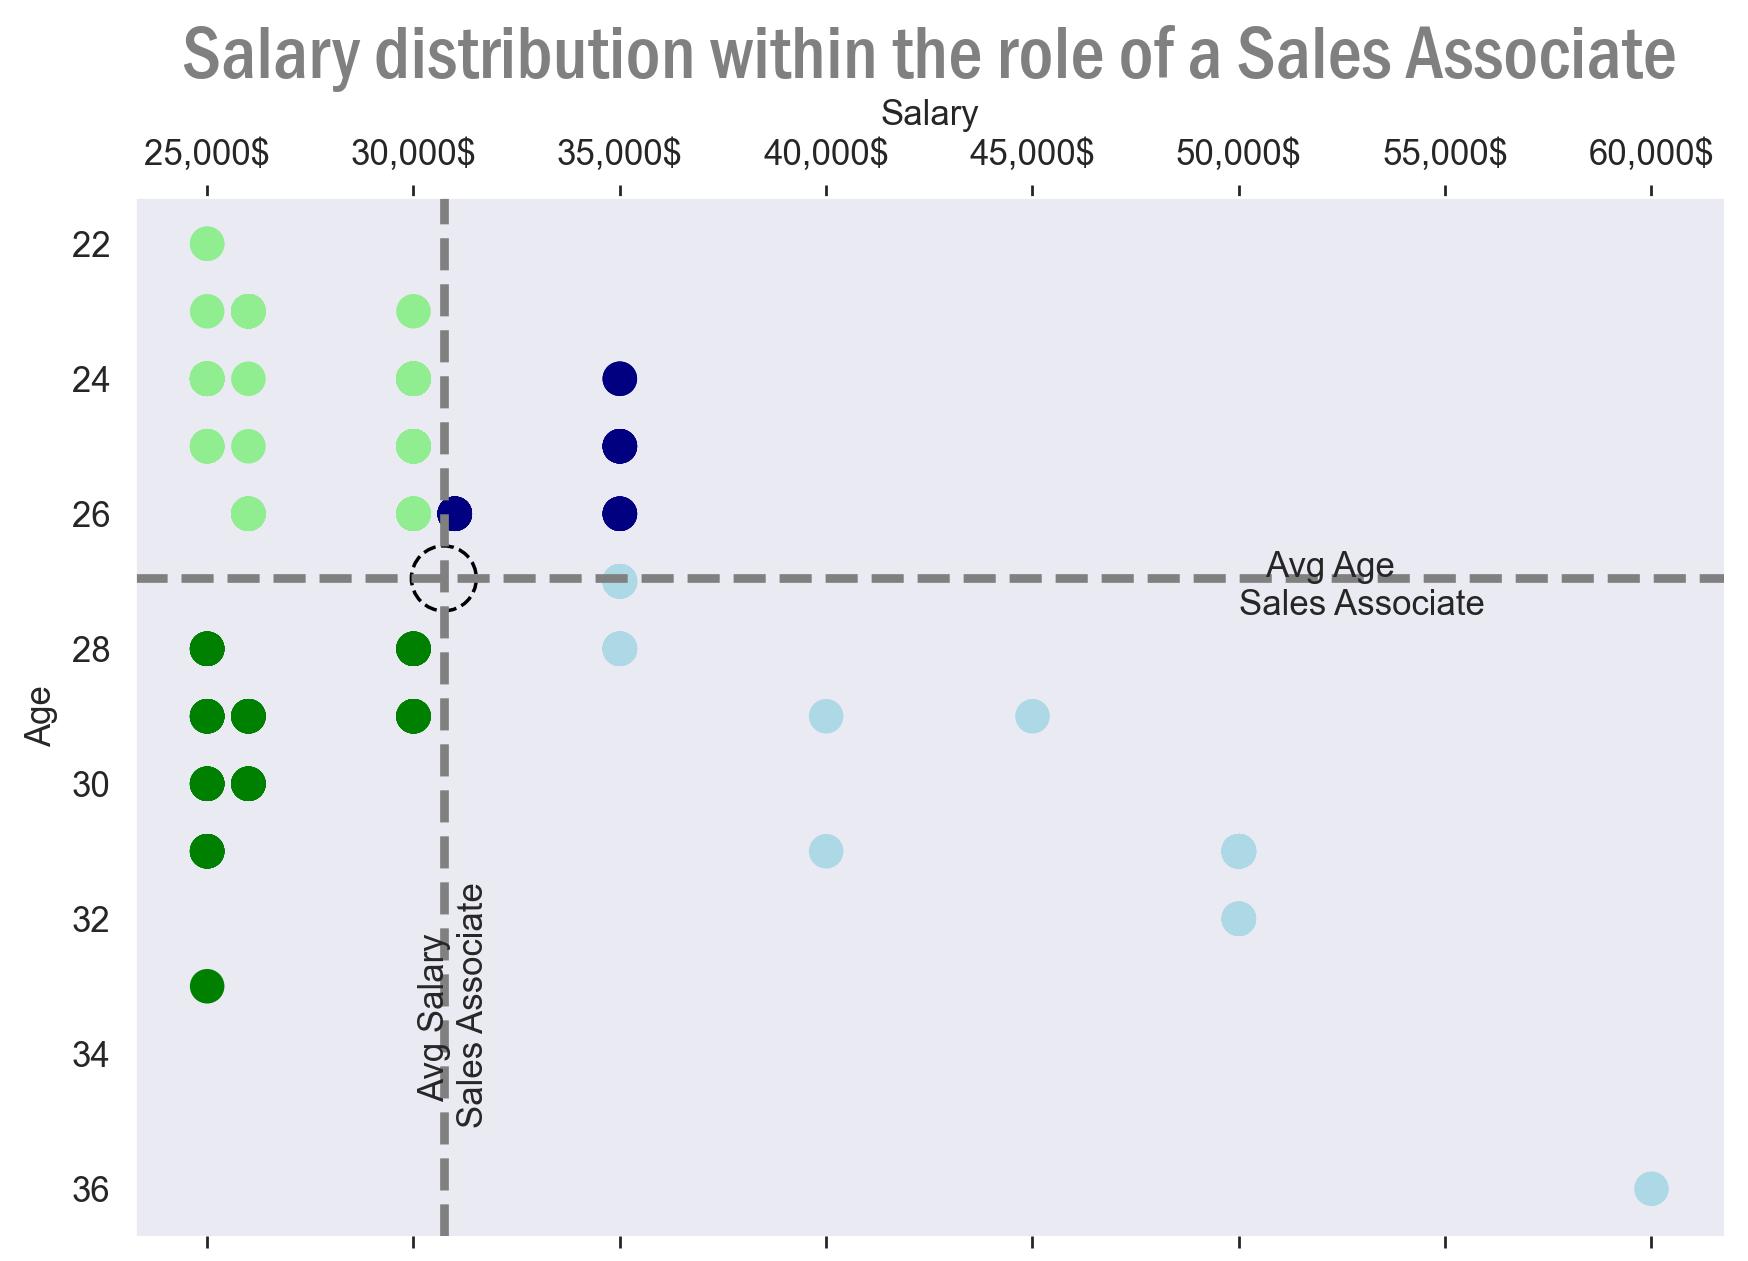
Now, let’s shift our focus to a distinct perspective by examining the output chart below for the role of a “Sales Associate”. A narrative different from that of a Data Scientist unfolds. In contrast to the Data Scientist role, as workers progress into their elder years, the most senior worker in the Sales Associate role is only 32 years old. This stands in contrast to the Data Scientist role, where we observed an average age of 33 years and a distribution spanning various age groups.
Moreover, a notable concentration appears in the upper-left corner of the chart, indicating a prevalence of exceptionally young workers earning salaries ranging from $25,000 to $30,000. This provides a unique insight into the age and salary dynamics specific to Sales Associate positions, setting it apart from the patterns observed in the Data Scientist role.
Notice! The average salary we are talking here is 31,000$ for a average age of 27 years old worker!
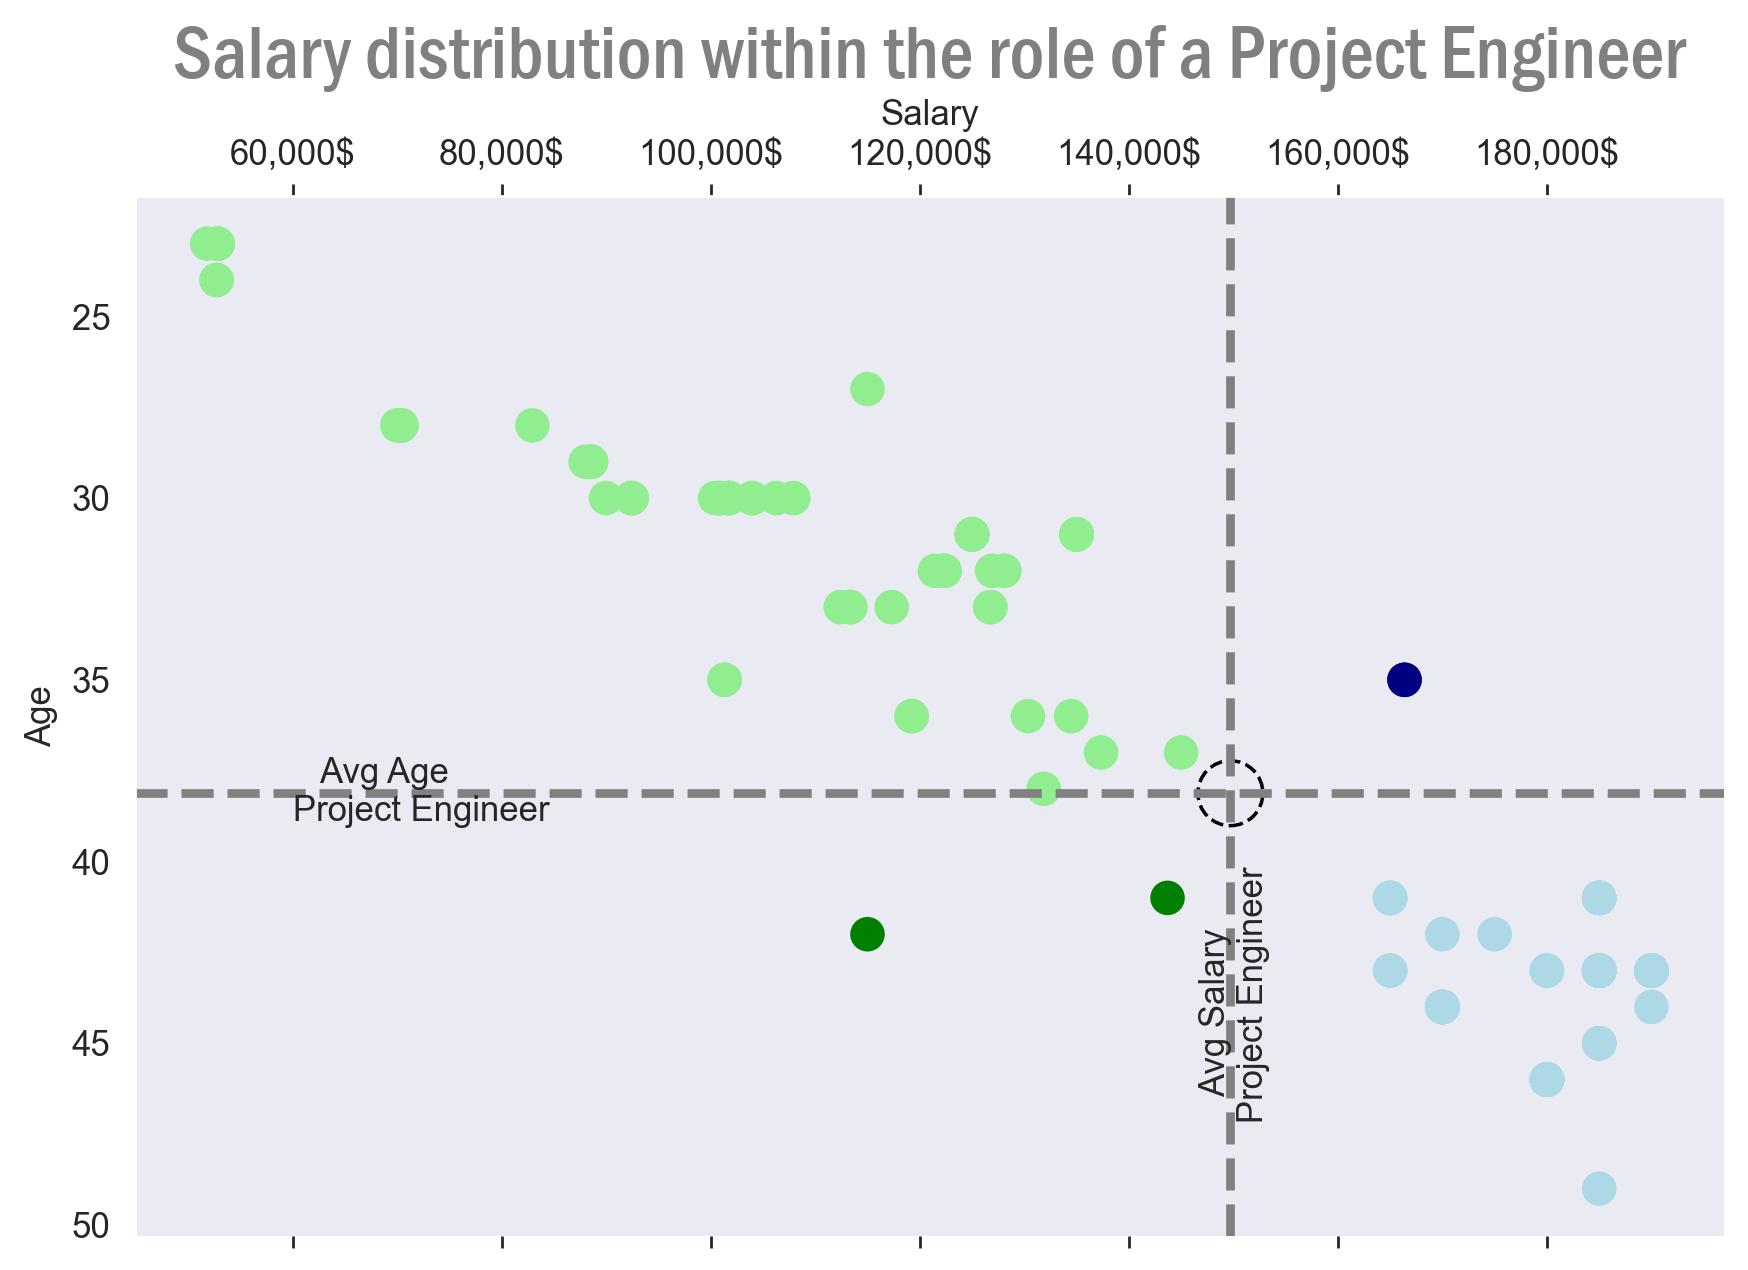
After examining two contrasting scenarios, let’s now explore the dynamics of the next job role - “Project Engineer”. In the chart below, we observe a significant concentration in both the upper-left and lower-right corners. This suggests a strong correlation between the two variables, implying that as workers age, their salaries tend to increase.
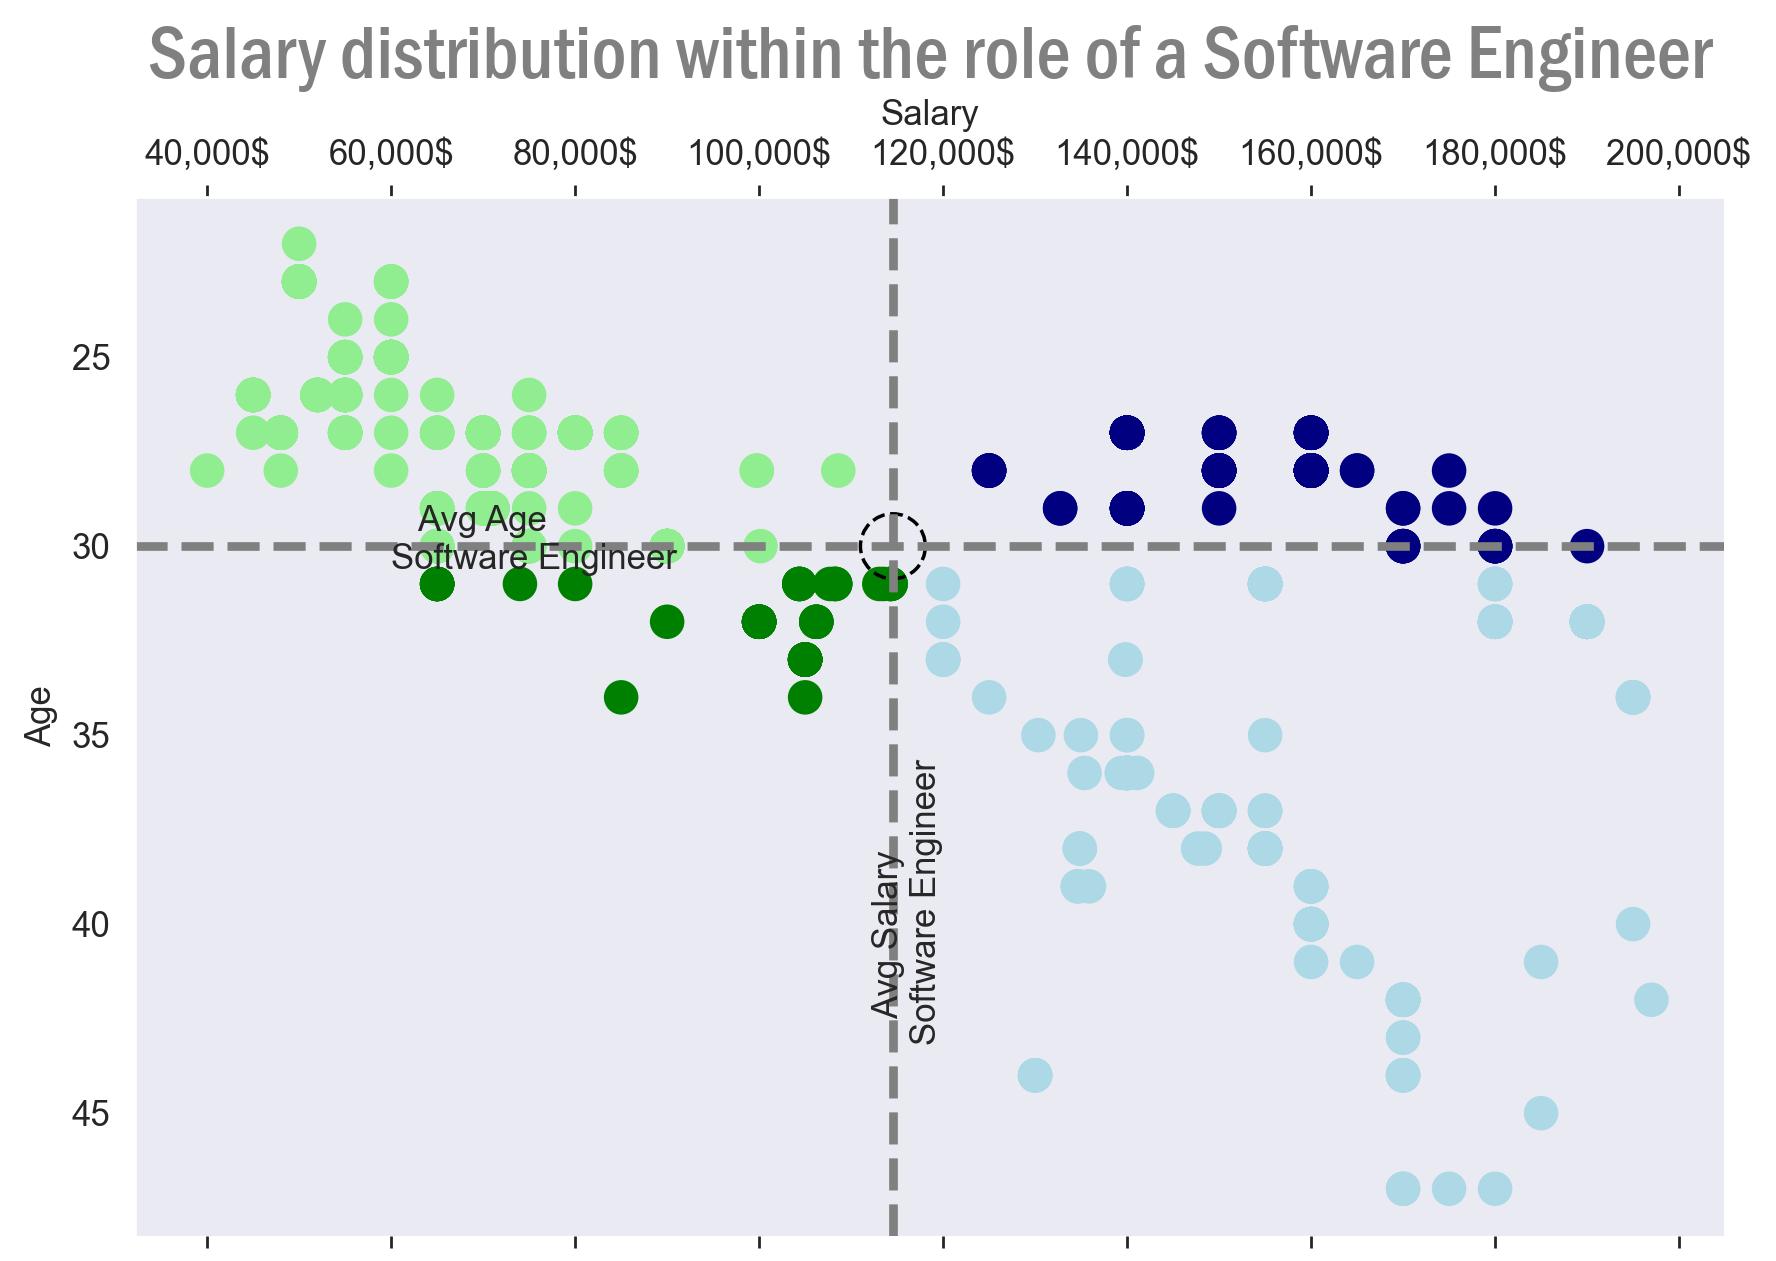
I would like to explore the latest research focusing on the role of a “Software Engineer.” As we examine the corresponding chart, it becomes evident that there is a substantial concentration of data points. Specifically, there are 807 individuals classified as Software Engineers, representing a significant portion of the workforce. This figure surpasses the number of workers identified as “Data Scientists” by 37%.
Upon closer inspection of the chart, it becomes apparent that the data points are distributed across various age groups. Notably, there are individuals below the age of 25 who are employed as Software Engineers, alongside workers in their late forties and fifties who continue to work in the same role. The salary distribution is also noteworthy, ranging from $40,000 to $200,000.
The intersection of these two broad ranges — age and salary — yields an average salary of $115,000 for a Software Engineer, particularly for those in their early thirties, which is the average age for individuals in this profession.