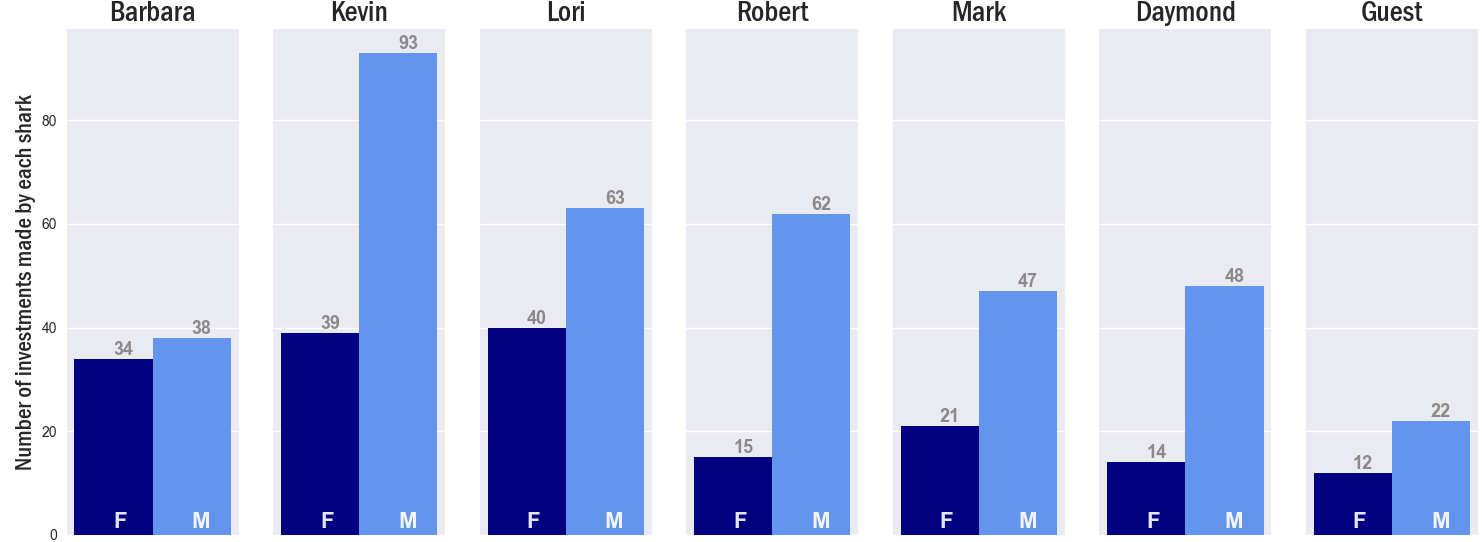
Investments per Shark by Gender in 10 Seasons (Part 2: Stats For Sharks)
Number of Investments Made by Each Shark Divided by Gender during the 10 Seasons
The chart below displays the number of deals made by each shark in the panel over the years during entrepreneur presentations. Specifically, we are interested in determining the number of closed deals made by each shark, categorized by gender (male and female). For instance, Kavin had the highest number of deals with 132, this number doesn’t excluding those made with multiple entrepreneurs. Out of these, 93 deals (70.4%) were with male entrepreneurs, while the remaining 39 (29.6%) were with female entrepreneurs.
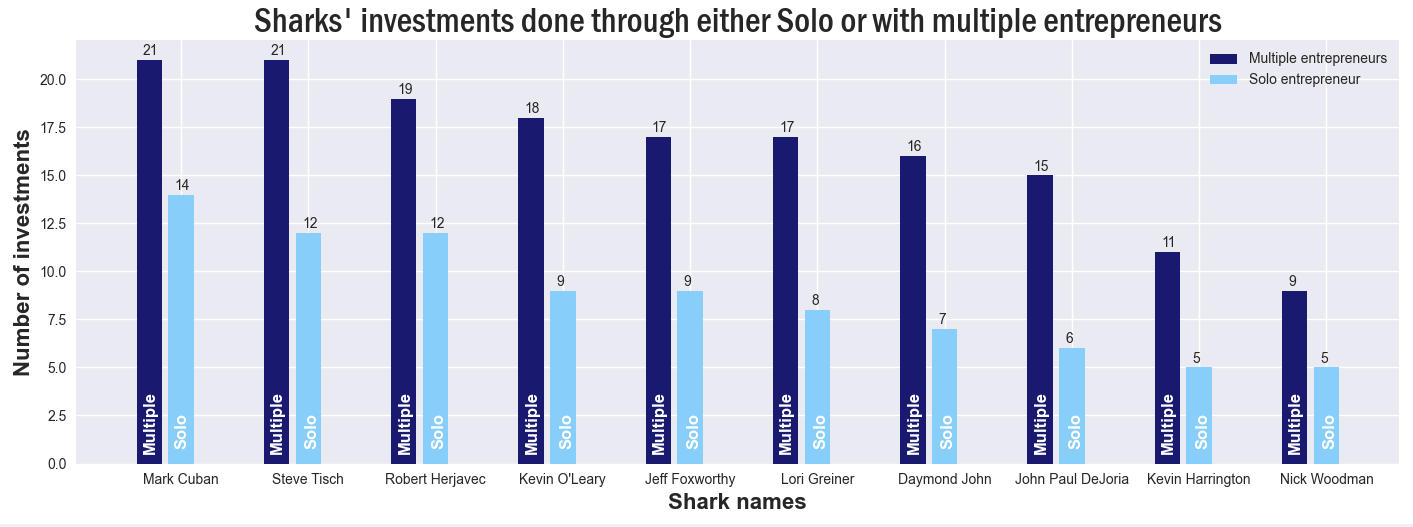
Shark Preferences: Multi-Entrepreneur vs. Solo Entrepreneur Investments
Our next objective is to determine the number of investments made by each shark with regards to entrepreneurs. Specifically, we want to understand the sharks’ preferences when it comes to investing in solo entrepreneurs versus multiple entrepreneurs. Interestingly, we observe that all sharks show a clear inclination towards investing in companies that have multiple partners rather than those led by a single individual. They tend to allocate a higher number of investments to companies with several stakeholders compared to those primarily led by a single person.