Highest-rated Episodes via Web Scraping (Part 4: Stats For Sharks)
Top episodes with the highest rating – Using Web Scraping
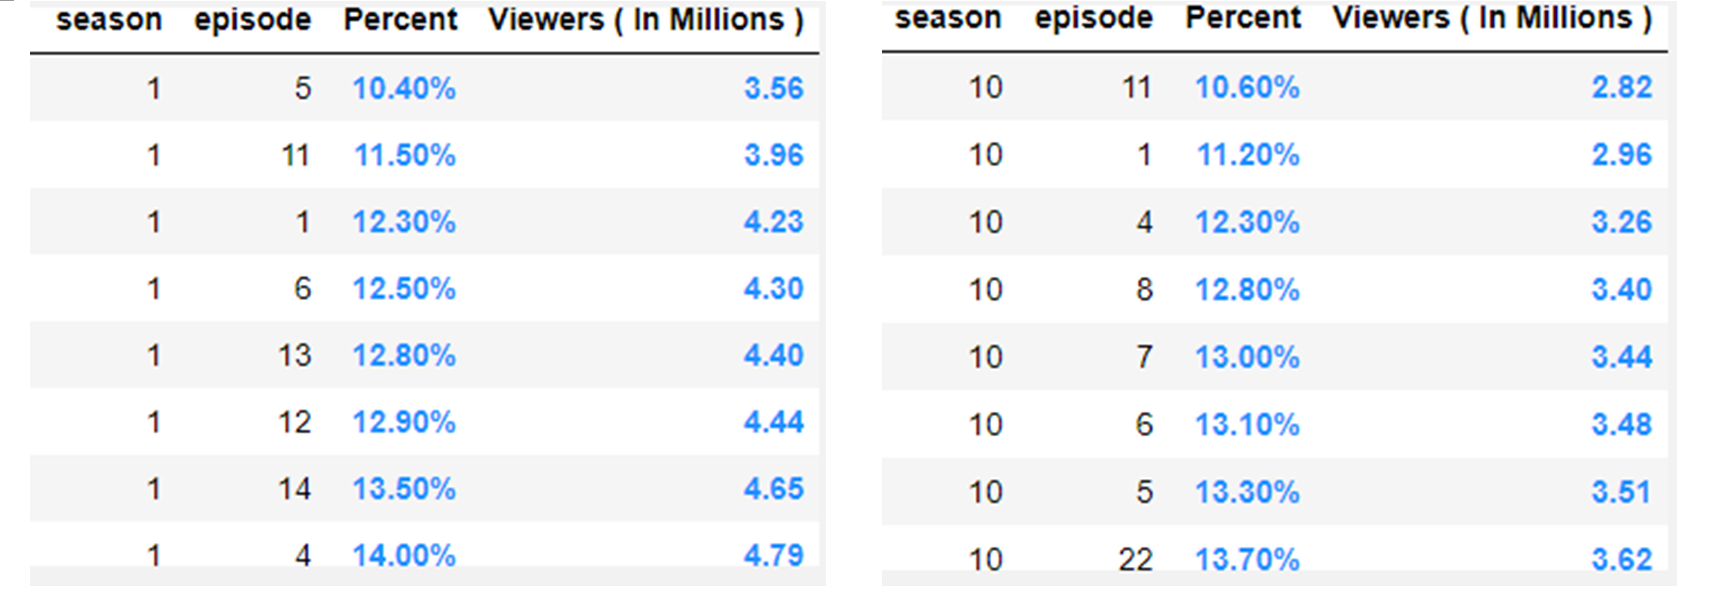
We wanted to gather information about the top episodes from each season of Shark Tank, spanning from the first season to the tenth season, which have been broadcasted on TV. Since this data was not available in our dataset, we conducted a web search and found the relevant information on the Wikipedia page for Shark Tank.
To extract the necessary details, we scraped the data from the Wikipedia page, specifically focusing on the following fields:
Season number Episode Number of viewers (audience) After retrieving this data, we proceeded to select the top 8 episodes for each season. We then visualized the results using a multi-bubble chart design created with Plotly.
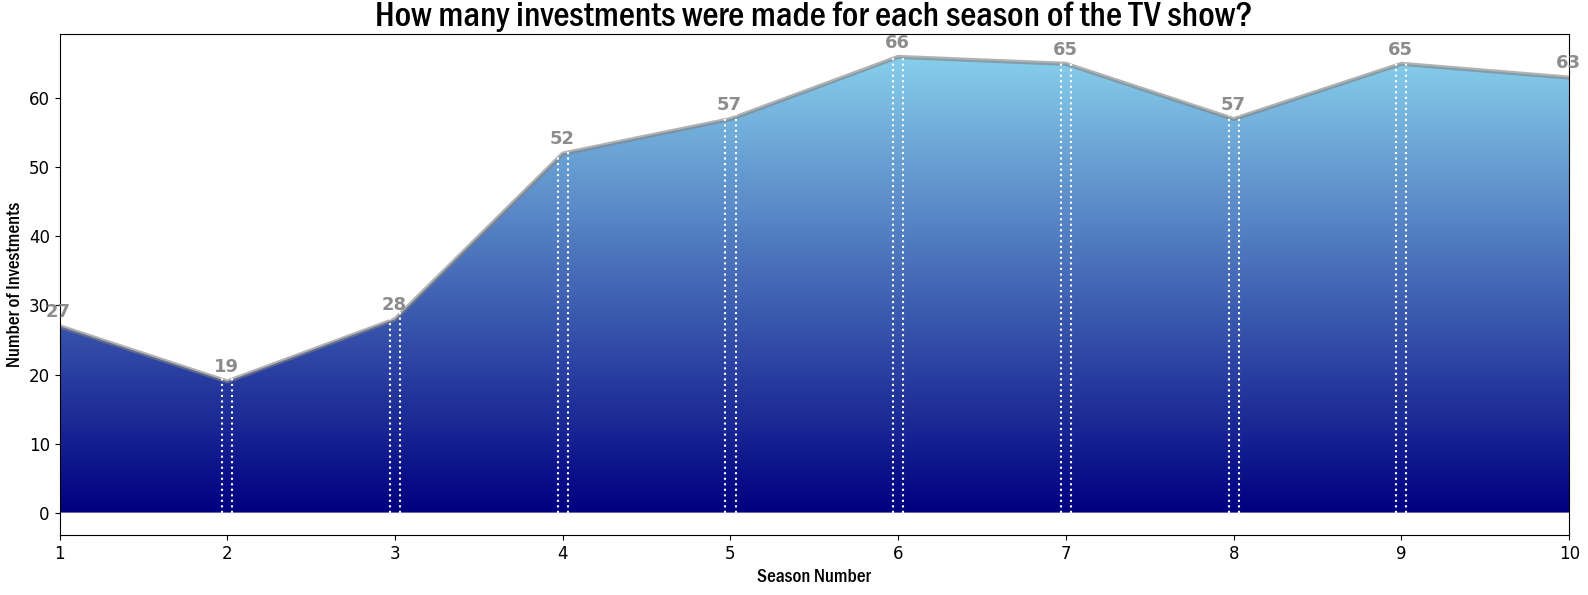
Number of Investments Made over the Seasons
Our initial objective is to analyse the dataset and gather information on the total number of investments made by the panel of sharks in each season. To accomplish this, we aim to present this data visually using an area chart.
Upon examining the data, we observe a significant surge in the number of investments over the years, particularly between the second and sixth seasons. During this period, there was a remarkable increase of almost ~250%, with investments rising from 19 in the second season to 66 in the sixth season.